
|
Meten Holding Group Ltd. (METX): 5 FORCES Analysis [Apr-2026 Updated] |
Completamente Editable: Adáptelo A Sus Necesidades En Excel O Sheets
Diseño Profesional: Plantillas Confiables Y Estándares De La Industria
Predeterminadas Para Un Uso Rápido Y Eficiente
Compatible con MAC / PC, completamente desbloqueado
No Se Necesita Experiencia; Fáciles De Seguir
Meten Holding Group Ltd. (METX) Bundle
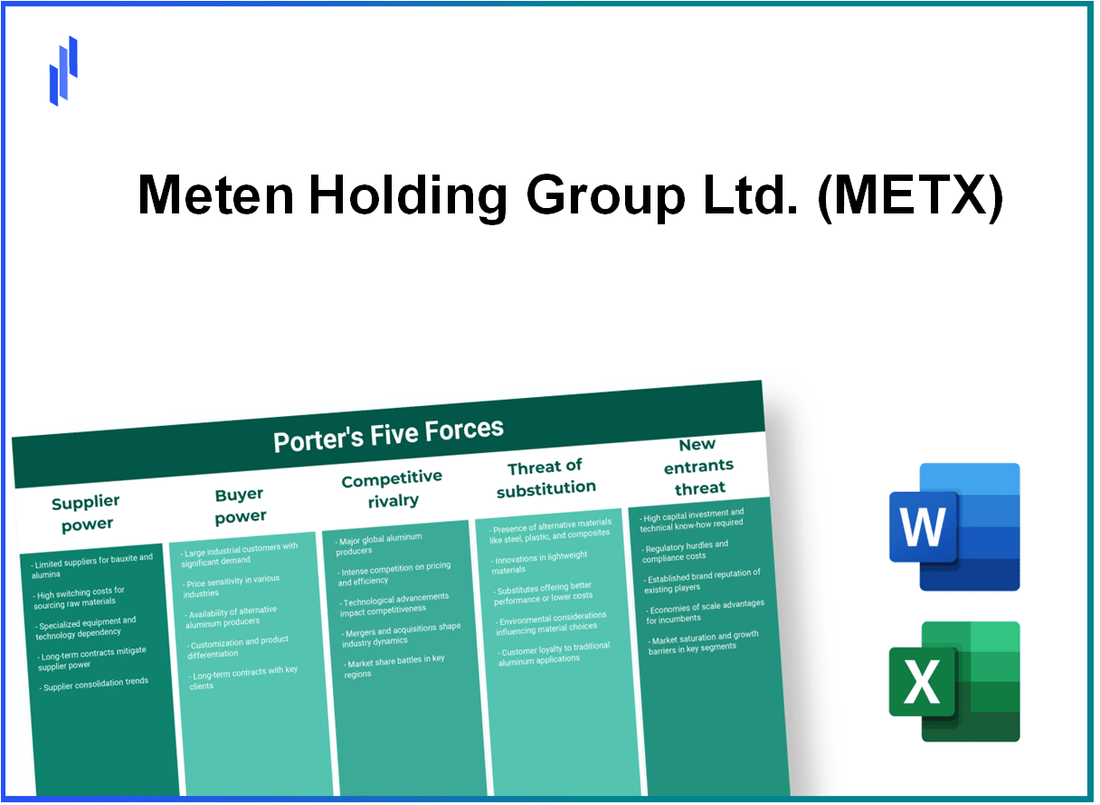
Meten Holding's dramatic pivot from education to crypto mining and blockchain has remade its risk profile - concentrated supplier power, price-taking customers, brutal competitive rivalry, plentiful digital substitutes, and mixed barriers for new entrants combine to make METX a high-stakes, margin-thin play; read on to see how each of Porter's Five Forces shapes the company's survival and upside potential.
Meten Holding Group Ltd. (METX) - Porter's Five Forces: Bargaining power of suppliers
Hardware procurement costs dominate operational expenses as the company pivots toward blockchain infrastructure and cryptocurrency mining. In the fiscal year ending December 2025, Meten (now BTC Digital) incurred $12,000,000 to acquire 1,500 ASIC mining units at an average unit cost approximately 18% above market-competitive pricing, creating an elevated baseline for future procurement rounds and pressuring margins.
The firm's supplier concentration is high: a limited set of specialized ASIC manufacturers and a small number of large data center hosts supply the critical inputs-mining rigs and power/hosting services. A single hosting agreement for 2,000 miners can dictate the majority of the company's $4,360,000 in capital expenditures in a given year, underscoring that individual supplier contracts materially influence overall CAPEX and operational flexibility.
With a reported gross margin of 2.69% as of late 2024, the company has very limited capacity to absorb price increases from hardware vendors or electricity providers. The limited number of high-performance chip manufacturers globally grants suppliers significant leverage over Meten's ability to maintain its 213 PH/s hash rate, and the company's dependency on a few key technology partners for its 2,021 mining machines makes it highly sensitive to supply chain disruptions and component lead-time volatility.
| Metric | Value | Notes |
|---|---|---|
| ASIC units purchased (2025) | 1,500 units | $12,000,000 total spend; ~$8,000 per unit |
| Total mining machines (installed) | 2,021 machines | Includes prior-generation units and recent purchases |
| Hash rate | 213 PH/s | Operational hash rate as of late 2024 |
| CAPEX exposure tied to single hosting deal | $4,360,000 | Majority of annual CAPEX can be driven by one hosting agreement |
| Gross margin | 2.69% | Low buffer versus supplier-driven cost increases |
| Supplier price premium paid | ~18% above competitors | Reflects urgency, short-term availability, or supplier bargaining power |
| Key suppliers | AGM Group Holdings + select ASIC fabs | High vendor concentration; few substitutes for high-efficiency chips |
Supplier-driven constraints and cost dynamics manifest across operational and strategic dimensions:
- Pricing pressure: Suppliers can impose higher per-unit prices or extended payment terms, directly compressing the company's already thin gross margin.
- Capacity & lead time risk: Chip fabrication cycles and shipment bottlenecks can delay fleet expansion or replacement, reducing realized hash rate and revenue.
- Energy contracting leverage: Electricity providers and hosting operators with available rack and power capacity can negotiate premium rates or rigid minimum commitments.
- After-sales & warranty dependence: Limited supplier options for high-efficiency ASICs increase downtime risk if service, RMA or spare part flows are constrained.
Mitigants required to manage supplier power include diversified sourcing across multiple ASIC vendors, long-term forward purchase agreements to lock in pricing and delivery, negotiating colocated power contracts with indexed or capped rates, and maintaining spare-part inventories to limit downtime. Quantitatively, reducing supplier price premium from 18% to 5% on future purchases of 2,000 units could lower acquisition spend by roughly $2.6 million (assuming comparable baseline unit pricing), materially alleviating margin pressure.
Given current exposures-$12M recent purchase, $4.36M CAPEX concentration risk, 2,021 machines, 213 PH/s hash rate and a 2.69% gross margin-the bargaining power of suppliers represents a critical vulnerability that can quickly erode operational profitability and growth plans if not actively managed through contracting, diversification and inventory strategies.
Meten Holding Group Ltd. (METX) - Porter's Five Forces: Bargaining power of customers
Individual and institutional investors in the digital asset space exert high bargaining power over Meten due to low switching costs and pronounced price sensitivity. Meten's market capitalization of approximately $17.99 million and a 52-week trading range of $1.32 to $26.58 reflect a highly volatile investor base that can exit positions instantly, increasing short-term pressure on share price and financing options.
As of December 2025, Meten's revenue mix is concentrated in bitcoin mining and machine resale, with 60.5% of historical total revenue previously coming from machine sales. Buyers in global secondary and primary hardware markets can compare prices across multiple platforms and regions, compressing margins and limiting Meten's ability to command premium pricing on equipment.
| Metric | Value |
|---|---|
| Market capitalization | $17.99 million |
| 52-week price range | $1.32 - $26.58 |
| Revenue share: machine sales (historical) | 60.5% |
| Revenue share: mined bitcoin (current) | 31.8% |
| Trailing net income | -$2.71 million |
| Reported international student enrollment change | +45% |
In the bitcoin-mining segment, customers are the global crypto market price and network participants; Meten is effectively a price-taker with zero bargaining power over the traded asset's market value. This reduces the company's ability to translate operational cost increases into higher prices, directly pressuring margins and contributing to negative trailing net income of -$2.71 million.
The education segment, which the company is scaling back, shows a shift toward a more geographically diverse but price-conscious customer base after a reported 45% increase in international student enrollments. Even with growing enrollment, individual learners and institutions remain sensitive to tuition and program pricing, constraining Meten's ability to raise prices in that segment.
- Low switching costs: cryptocurrency holders and hardware buyers can switch providers or markets rapidly.
- High price transparency: global marketplaces and price indices enable easy comparison for machine and bitcoin pricing.
- Concentrated revenue dependency: 60.5% historical reliance on machine sales increases vulnerability to customer bargaining.
- Market-driven commodity: 31.8% revenue from mined bitcoin ties income to BTC price volatility, eliminating pricing leverage.
Customer bargaining power manifests in several measurable operational impacts: compressed resale margins on mining machines, greater volatility in revenue linked to BTC price swings, potential discounting to move inventory, and limited capacity to pass through increased electricity or maintenance costs to end-buyers or to set differentiated premium pricing for hardware or mined output.
Meten Holding Group Ltd. (METX) - Porter's Five Forces: Competitive rivalry
Competitive rivalry in the cryptocurrency mining sector imposes severe pressure on Meten Holding Group Ltd. (METX). As a small-cap operator with trailing 12-month revenue of $8.48 million and just $27,000 in cash late 2024, Meten must compete on price and efficiency against much larger miners and hosting providers that achieve far higher hash rates and lower energy costs.
Key financial and performance indicators:
| Metric | Meten (METX) | Industry Leaders (typical) |
|---|---|---|
| Trailing 12-month revenue | $8.48 million | $500 million - $5+ billion |
| Operating margin | -17.83% | +10% to +40% |
| Cash on hand (late 2024) | $27,000 | $10 million - $2+ billion |
| 5‑year stock return | -99.85% | Varies; many peers outperform the S&P 500 |
| Market capitalization | Small-cap (substantially below $1B) | Large-cap (often >$1B) |
| Typical cost advantages | Higher per‑unit energy and hosting costs (Tennessee facilities) | Lower energy cost per TH/s; optimized cooling and scale |
The competitive landscape can be summarized in operational and strategic pressures:
- Economies of scale: Larger miners and publicly traded firms realize lower unit costs through bulk hardware procurement, long‑term power contracts, and optimized facility utilization.
- Hash rate dominance: Massive mining pools and vertically integrated operators control a larger share of network hash rate, translating into more consistent mining revenue and lower variance.
- Energy cost differential: Competitors located in regions with subsidized or cheaper electricity achieve materially better margins than Tennessee-based hosting facilities that face higher utility and cooling expenses.
- Capital intensity and reinvestment: Rapid hardware obsolescence forces continuous CAPEX; Meten's limited cash ($27k) constrains its ability to refresh ASIC fleets and scale hash rate.
- Market valuation pressure: The stock's -99.85% five‑year return versus the S&P 500's multi‑year growth trends reduces access to equity capital and increases vulnerability to dilution or distressed financing.
Specific operational risks tied to rivalry:
- Compression of margins: Meten's -17.83% operating margin indicates inability to cover fixed costs when competing prices are set by low‑cost operators.
- Reinvestment gap: Limited liquidity increases the probability of falling behind in hash‑rate upgrades as network difficulty rises, reducing expected BTC yield per unit of compute.
- Customer and hosting pressure: Competing hosting providers with scale can underprice services or bundle hosting with lower energy rates, eroding Meten's contract renewals and utilization.
Because rivalry in mining is driven by scale, cost structure, hardware refresh cycles and access to capital, Meten's financial profile-low revenue, negative operating margin, negligible cash reserves and severe stock depreciation-places it at a structural disadvantage against billion‑dollar competitors that exploit superior scale economies, lower energy costs and higher liquidity to maintain sustained competitive advantage.
Meten Holding Group Ltd. (METX) - Porter's Five Forces: Threat of substitutes
Threat of substitutes for Meten originates from two principal domains: alternative investment/crypto services and AI-driven online education platforms. The company's dual-track model-education services and blockchain-related investments-faces substitution pressure from lower-cost, scalable digital alternatives that offer comparable utility with stronger adoption curves and often superior unit economics.
In the digital asset space, spot Bitcoin/ETH exchange-traded funds (ETFs), centralized staking-as-a-service providers, and decentralized finance (DeFi) protocols act as direct and indirect substitutes for Meten's blockchain-related revenue efforts. Meten's entry into Ethereum staking in 2024 reduced single-asset exposure to Bitcoin mining, but competing services offer:
- Lower fees via economies of scale (institutional staking pools)
- Regulatory clarity for ETFs attracting risk-averse capital
- Higher liquidity and instant tradability in spot ETFs vs. lock-up staking products
In the education vertical, global market growth expectations expand the pool of substitutes rather than secure demand for Meten's legacy tutoring. The global online education market is projected to reach $375 billion by 2026, driven by AI-powered personalized learning, adaptive testing, and automated conversational tutors that significantly lower marginal cost per student compared to one-on-one human tutoring.
Key quantitative comparisons of substitute offerings versus Meten's current position:
| Metric | Meten (METX) - current | AI-driven EdTech substitutes | Crypto substitutes (Spot ETFs / Staking providers) |
|---|---|---|---|
| Enterprise value | $3.94M | Top players: $500M-$50B | Major custodial firms: $1B-$100B |
| Free cash flow | -$164.94K | Positive at scale; R&D budgets $10M+ | Large providers: positive FCF; high liquidity |
| Product differentiation | Limited; hybrid education + blockchain | AI personalization, adaptive curricula | Regulated ETFs, diversified staking pools |
| Unit cost per user / customer | High (human tutors; limited scale) | Low (AI automation) | N/A (investment product fees 0.00%-2.0%) |
| Regulatory risk impact | High (2021 China tutoring crackdown revealed vulnerability) | Varies by jurisdiction; generally favorable online adoption | Depends on asset class; ETFs favored by regulators |
The 2021 Chinese regulatory crackdown acted as a structural substitute: state-sanctioned non-profit models and regulatory limits replaced the for-profit tutoring market overnight, forcing Meten to reassess its core model and accelerate diversification into blockchain. That regulatory-driven substitution demonstrates how exogenous policy shifts can instantly render an existing business model nonviable.
Factors raising the threat of substitutes for Meten:
- Scale advantages of established EdTech and crypto platforms that enable lower per-user costs and deeper R&D investment.
- Faster feature development cycles of AI language models and automated tutoring systems, decreasing marginal cost and increasing personalization.
- Investor preference shifts toward regulated, liquid crypto products (spot ETFs) that crowd out smaller staking providers.
- Limited financial resources for differentiation: negative FCF (-$164.94K) and modest enterprise value ($3.94M) constrain product and marketing investment.
- Persistent regulatory uncertainty in China and internationally, which can substitute business models through policy changes.
Quantifiable indicators of substitution pressure and market context:
| Indicator | Value / Estimate |
|---|---|
| Projected global online education market (2026) | $375 billion |
| Meten enterprise value | $3.94 million |
| Meten free cash flow | -$164,940 |
| Year of Chinese tutoring crackdown | 2021 |
| Meten Ethereum staking launch | 2024 |
Strategic implications relevant to the threat of substitutes: Meten must contend with technologically superior, lower-cost alternatives in both verticals while operating with constrained capital. Without accelerated R&D investment, partnerships with larger platforms, or clear regulatory hedges, substitution risk is elevated and persistent.
Meten Holding Group Ltd. (METX) - Porter's Five Forces: Threat of new entrants
Threat of new entrants for Meten Holding Group Ltd. (METX) is mixed: low barriers to entry in resale, hosting and small-scale mining contrast with high capital intensity and energy cost requirements for industrial-scale operations. Meten's reported 213 PH/s hashing capacity and a headcount of 21 employees illustrate a lightweight operational posture in the mining ecosystem that can be duplicated quickly by niche entrants focused on resale, hosting or colocated ASIC management.
Key quantitative indicators influencing entrant threat:
| Metric | Value | Implication for entrant threat |
|---|---|---|
| Hashing capacity | 213 PH/s | Modest scale - easy to surpass by better-funded entrants |
| Employees | 21 | Lean organization - indicates low fixed-cost overhead for niche operations |
| Debt-to-equity ratio | 0.02 | Minimal leverage - limited defensive investment capacity |
| Enterprise value change | -75.90% | Weakened market positioning and capital access risk |
| Geographic moves | Tennessee, Arkansas | Targeting low-cost energy regions - entrants can replicate site selection |
Barriers that raise the cost of entry:
- High upfront capital for industrial-scale ASIC fleets and facility build-out.
- Need for reliable, low-cost power contracts and grid access to reach competitive electricity cost per TH/J.
- Operational expertise in cooling, maintenance, and mining pool optimization at scale.
- Regulatory and permitting requirements for large datacenter-like mining farms in host jurisdictions.
Barriers that lower the cost of entry:
- Resale and hosting segments require minimal headcount and can be launched with 10s of staff.
- Secondary equipment markets allow entrants to acquire used ASICs at lower capex.
- Cloud/mining-as-a-service models allow capital-light entry via third-party infrastructure.
- Lack of proprietary technology at Meten - standard commodity ASICs and common software stacks.
Competitive leverage and vulnerability metrics:
| Factor | Meten Position | Impact on ability to deter entrants |
|---|---|---|
| Proprietary technology | None reported | Low - entrants can match operations with newer ASICs |
| Access to cheap power | Relocation to Tennessee/Arkansas (strategic move) | Moderate - presence in low-cost regions but replicable |
| Financial strength | Low leverage; EV down 75.90% | Low - constrained ability to scale quickly |
| Scale economies | 213 PH/s | Low - larger entrants gain cost per TH advantage |
Scenario analysis of entrant threat:
- Well-funded entrants: High threat. Entities with capital can secure PPAs, deploy new-generation ASIC fleets and scale beyond Meten's 213 PH/s, exploiting Meten's minimal leverage and 75.90% EV decline.
- Small niche entrants: Moderate threat. Resale/hosting businesses can be established quickly (as Meten itself pivoted with 21 employees), competing on service rather than scale.
- Vertical integrators (energy + mining): Very high threat. Firms with direct energy assets or long-term PPAs can undercut power costs and achieve superior margins, negating Meten's geographic moves.
Operational levers available to Meten to raise entry barriers (observed status):
- Secure longer-term, lower-cost power purchase agreements (current moves indicate focus, but not exclusivity).
- Increase scale beyond 213 PH/s to capture economies of scale (requires capital; low debt usage suggests limited current investment).
- Pursue differentiated hosting services or vertical integration to create switching costs for customers.
Disclaimer
All information, articles, and product details provided on this website are for general informational and educational purposes only. We do not claim any ownership over, nor do we intend to infringe upon, any trademarks, copyrights, logos, brand names, or other intellectual property mentioned or depicted on this site. Such intellectual property remains the property of its respective owners, and any references here are made solely for identification or informational purposes, without implying any affiliation, endorsement, or partnership.
We make no representations or warranties, express or implied, regarding the accuracy, completeness, or suitability of any content or products presented. Nothing on this website should be construed as legal, tax, investment, financial, medical, or other professional advice. In addition, no part of this site—including articles or product references—constitutes a solicitation, recommendation, endorsement, advertisement, or offer to buy or sell any securities, franchises, or other financial instruments, particularly in jurisdictions where such activity would be unlawful.
All content is of a general nature and may not address the specific circumstances of any individual or entity. It is not a substitute for professional advice or services. Any actions you take based on the information provided here are strictly at your own risk. You accept full responsibility for any decisions or outcomes arising from your use of this website and agree to release us from any liability in connection with your use of, or reliance upon, the content or products found herein.