
|
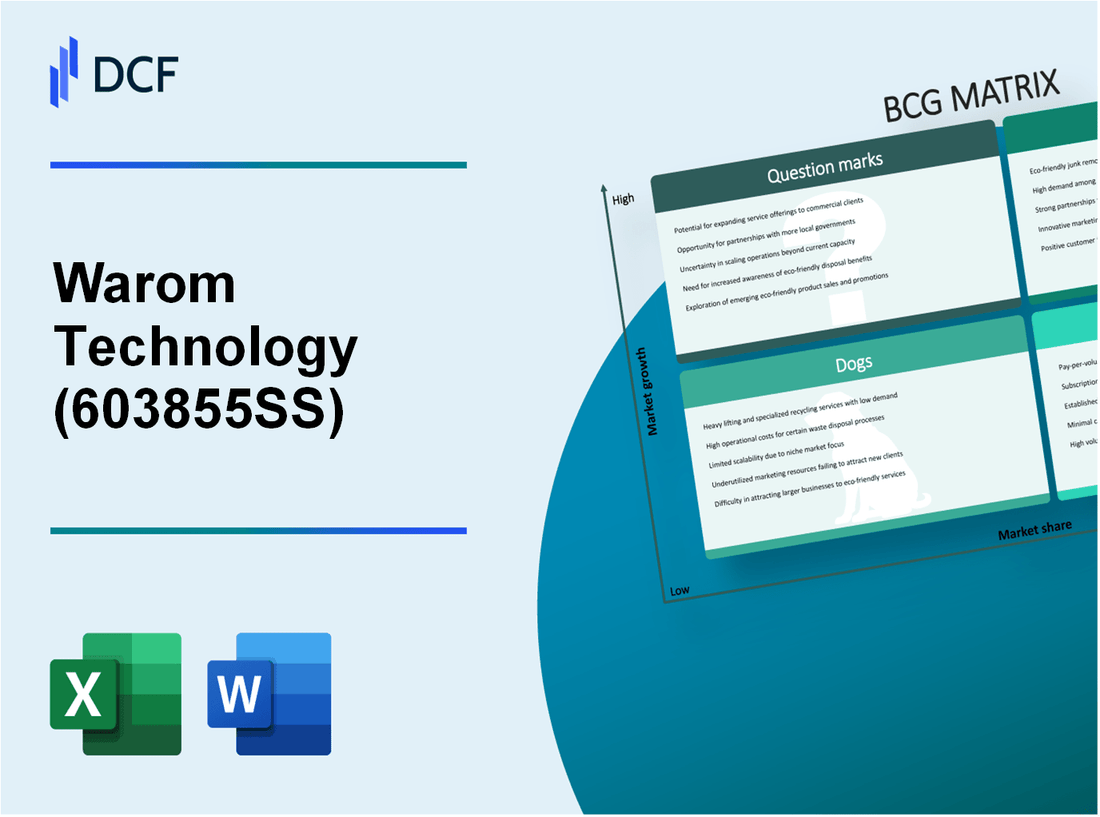
Warom Technology Incorporated Company (603855.SS): BCG Matrix [Apr-2026 Updated] |
Entièrement Modifiable: Adapté À Vos Besoins Dans Excel Ou Sheets
Conception Professionnelle: Modèles Fiables Et Conformes Aux Normes Du Secteur
Pré-Construits Pour Une Utilisation Rapide Et Efficace
Compatible MAC/PC, entièrement débloqué
Aucune Expertise N'Est Requise; Facile À Suivre
Warom Technology Incorporated Company (603855.SS) Bundle
Warom's portfolio balances high-growth "stars" in intelligent safety clouds, international EPC and nuclear safety-each commanding strong margins but demanding targeted CAPEX-with dominant cash cows in traditional explosion‑proof hardware and industrial lighting that generate the bulk of free cash flow to fund expansion; meanwhile, capital is being selectively deployed into ambitious but low‑share question marks (new energy storage, marine, hydrogen) while marginal dogs are being deprioritized, a mix that will determine whether Warom converts emerging opportunities into market leadership-read on to see where management should double down or cut losses.
Warom Technology Incorporated Company (603855.SS) - BCG Matrix Analysis: Stars
The 'Stars' category for Warom comprises high-growth, high-market-share business units that require continued investment to sustain leadership and capitalize on market expansion. Below are detailed profiles for each Star business unit with quantifiable metrics through late 2025.
Intelligent Safety Cloud Platform Systems: This digital transformation segment addresses hazardous environment monitoring and integrated smart explosion‑proof solutions. Market growth in the hazardous environment digital segment reached 28% in 2025. Warom's domestic share in smart explosion‑proof integration is 16%, contributing 14% of consolidated revenue and delivering strong operating margins of 24%.
| Metric | Value |
|---|---|
| Market Growth Rate (2025) | 28% |
| Domestic Market Share | 16% |
| Share of Total Corporate Revenue | 14% |
| Operating Margin | 24% |
| R&D CAPEX (of segment sales) | 9% |
| ROI on Smart Sensing Hardware (Q4 2025) | 19% |
- Key investment focus: maintain 9% of segment sales in digital R&D to preserve technological leadership.
- Revenue drivers: recurring cloud subscriptions, system integration contracts, and smart sensing hardware sales.
- Risk factors: need for sustained R&D spend to match rapid market growth and defend against software-enabled entrants.
International EPC Oil and Gas Projects: Warom's export-led EPC presence in large-scale energy projects is a major growth engine. Export revenue growth for large-scale energy projects reached 22% YoY by December 2025. Warom commands a 32% share of the Middle Eastern market among Chinese exporters of explosion‑proof equipment. This segment now contributes 30% of total company revenue (up from 26% previously), with strong project-based gross margins of 38%.
| Metric | Value |
|---|---|
| Export Revenue Growth (YoY, Dec 2025) | 22% |
| Market Share in Middle East (among Chinese exporters) | 32% |
| Share of Total Revenue | 30% |
| Previous Share | 26% |
| Project Gross Margin | 38% |
| Overseas Logistics CAPEX | 150 million RMB |
- Strategic allocation: 150 million RMB CAPEX for overseas logistics hubs to support project scalability and reduce lead times.
- Profitability drivers: premium pricing for high-spec safety solutions and long-term EPC contracts.
- Operational priorities: strengthen local logistics, project financing structures, and after-sales service networks to protect margins.
Nuclear Power Safety Equipment: The nuclear safety equipment unit focuses on explosion‑proof lighting and specialized components for new reactor builds. The domestic nuclear equipment market expanded at 15% annually as of late 2025. Warom holds a 12% share in specialized explosion‑proof lighting for new reactors. Segment revenue increased 19% year-to-date, and gross margins for nuclear-grade components are 42%.
| Metric | Value |
|---|---|
| Domestic Market Growth Rate (Nuclear Equipment) | 15% annually |
| Warom Market Share (specialized lighting) | 12% |
| Segment Revenue Growth (YTD 2025) | 19% |
| Gross Margin (nuclear-grade components) | 42% |
| Return on Assets (specialized manufacturing line) | 21% |
- Value proposition: specialized certification, high safety standards, and premium margins create a defensible niche.
- Financial characteristics: high gross margins (42%) and ROA (21%) justify continued capital allocation for capacity and compliance testing.
- Growth opportunities: accelerate product qualification cycles and capture share from new reactor pipeline expansions.
Warom Technology Incorporated Company (603855.SS) - BCG Matrix Analysis: Cash Cows
Cash Cows - this chapter isolates Warom's low-growth, high-share business units that generate steady free cash flow and fund other corporate initiatives.
Traditional Explosion Proof Electrical Appliances
The traditional explosion-proof electrical appliances segment maintains a dominant 23% share of the Chinese domestic market. Market growth for traditional hardware has stabilized at a mature 5% in 2025. This unit contributes 46% of total company revenue and delivers net profit margins of 16%. Capital expenditure (CAPEX) requirements are minimal at 3% of segment revenue, producing significant free cash flow that supports R&D and working capital.
| Metric | Value |
|---|---|
| Domestic Market Share | 23% |
| Market Growth Rate (2025) | 5% |
| Contribution to Corporate Revenue | 46% |
| Net Profit Margin | 16% |
| Segment CAPEX (% of segment revenue) | 3% |
| Estimated Free Cash Flow Yield (segment level) | ~13% of segment revenue |
- High cash generation due to low CAPEX and stable margins.
- Limited organic upside given single-digit market growth; focus on efficiency and cost control.
- Key funding source for innovation and expansion in adjacent sectors.
Industrial LED Lighting Solutions
The industrial LED lighting solutions unit holds a 19% share in the domestic heavy-industry lighting sector. The high-end industrial lighting market grows at a modest 4% annually as of December 2025. This segment accounts for 25% of total revenue and generates operating margins of 21%, supported by scale and mature supply chains. Return on investment (ROI) for existing production facilities is high at 26%, making the unit a reliable cash contributor with moderate reinvestment needs.
| Metric | Value |
|---|---|
| Domestic Market Share | 19% |
| Market Growth Rate (2025) | 4% |
| Contribution to Corporate Revenue | 25% |
| Operating Margin | 21% |
| ROI on Production Facilities | 26% |
| Estimated CAPEX (% of segment revenue) | ~4-5% |
- Strong ROI enables selective reinvestment to maintain technology edge.
- Stable margins and scale economics secure liquidity for corporate allocation.
- Growth constrained to mid-single digits; focus on product mix optimization and aftermarket integration.
Specialized Maintenance and Aftermarket Services
The specialized maintenance and aftermarket services segment serves the installed base for explosion-proof equipment and grows predictably at 6% per year. Warom captures 15% of the domestic service market. Recurring revenue from service contracts represents 11% of total corporate revenue. CAPEX requirements are very low, typically under 2% of segment revenue, while profit margins average 30% in FY2025, outperforming hardware lines and providing sticky, high-margin cash flow.
| Metric | Value |
|---|---|
| Domestic Service Market Share | 15% |
| Service Market Growth Rate (2025) | 6% |
| Contribution to Corporate Revenue | 11% |
| Segment CAPEX (% of segment revenue) | <2% |
| Average Profit Margin (FY2025) | 30% |
| Recurring Revenue Ratio (service contracts) | ~70% of segment revenue |
- High-margin, low-CAPEX profile enhances overall corporate profitability.
- Recurring contracts increase revenue predictability and customer retention.
- Opportunity to upsell digital monitoring and preventive services to increase ARPU.
Warom Technology Incorporated Company (603855.SS) - BCG Matrix Analysis: Question Marks
Dogs (Question Marks) - New Energy Storage Safety Components: The market for safety equipment in lithium-ion and hydrogen storage is growing at an estimated compound annual growth rate (CAGR) of 36% (2024-2028). Warom holds a 4% share of this emergent niche, representing a small relative market share versus leading global suppliers. The segment requires sustained R&D spend equal to 12% of segment revenue to meet fast-evolving battery safety standards and certification requirements. Operating margins are currently thin at 7% due to introductory pricing and channel development costs. Warom allocated 20% of total 2025 CAPEX to establish specialized production lines and automated test cells for safety components, representing approximately RMB 160 million of CAPEX (company total CAPEX 2025 ≈ RMB 800 million).
Dogs (Question Marks) - Marine and Offshore Engineering Equipment: Global equipment demand for offshore wind, oil & gas platform safety and marine structural protection is growing roughly 13% in 2025. Warom's global marine segment market share is limited at ~3%, contributing about 6% to consolidated revenue. Gross margins are compressed at 18% as the company invests in product qualification, international maritime certifications (e.g., DNV, ABS) and supplier audits to access Tier-1 OEM channels. Return on invested capital (ROIC) is low at ~5% while the unit scales production and secures long-lead qualification projects. Competitive pressure from established European manufacturers has required targeted pricing and extended warranty/qualification services, increasing working capital and certification costs.
Dogs (Question Marks) - Hydrogen Energy Infrastructure Safety: The hydrogen refueling, storage and production safety market is expanding at an estimated 40% per year. Warom's penetration is nascent with a market share near 2% and segment revenue contribution below 3% of corporate totals. Initial hydrogen-specific CAPEX includes RMB 80 million invested in 2025 for dedicated testing laboratories, high-pressure test benches, and explosion-proof R&D facilities. Current ROI is negative as commercialization remains limited; the company is prioritizing strategic positioning, regulatory alignment, and long-term product validation over short-term profitability.
| Segment | Market CAGR | Warom Market Share | Revenue Contribution | R&D as % of Segment Revenue | Operating/Gross Margin | 2025 CAPEX Allocation | ROI / ROIC |
|---|---|---|---|---|---|---|---|
| New Energy Storage Safety Components | 36% | 4% | ~4-5% of total revenue (estimated) | 12% | Operating margin 7% | 20% of total CAPEX (~RMB 160m) | Low but improving; single-digit positive margin (7%) |
| Marine & Offshore Engineering Equipment | 13% | 3% | 6% of total revenue | ~6-8% (qualification & engineering) | Gross margin 18% | Minor dedicated CAPEX; qualification-related spend significant | ROIC ~5% |
| Hydrogen Energy Infrastructure Safety | 40% | 2% | <3% of total revenue | High early-stage R&D; spend not yet stabilized | Margins negative | RMB 80m initial CAPEX (testing labs) | Negative ROI (investment phase) |
Key commercial and technical issues affecting these Question Mark units:
- Market access barriers: international certifications (marine safety), hydrogen regulatory approvals, and battery safety standard harmonization.
- High upfront capital and fixed-cost intensity for specialized production lines and test facilities (RMB 80-160m per major initiative in 2025).
- Pricing pressure and incumbent competition forcing suppressed margins during scale-up (operating margins range 7% to negative).
- R&D intensity and product validation timelines: 12% of segment revenue in storage safety and elevated undisclosed R&D spend for hydrogen safety.
- Revenue concentration risk: combined revenue contribution from these units remains modest (aggregate <15%), limiting internal funding capacity without external partnerships or targeted customer contracts.
Strategic options under consideration for these Dog/Question Mark units include selective investment to reach critical scale, co-development or licensing with Tier-1 OEMs, targeted margin improvement initiatives (value-engineering and modular product designs), and potential divestiture of non-core lines if market traction remains insufficient after predefined milestones (18-36 months).
Warom Technology Incorporated Company (603855.SS) - BCG Matrix Analysis: Dogs
Dogs - Low-growth, low-share units that consume resources without meaningful return. The following analysis details three Dog segments within Warom's portfolio, quantifying market growth, market share, revenue contribution, margins, ROI, and capital allocation to inform divestiture or harvesting decisions.
Low End Commercial Lighting Products: the generic commercial lighting segment recorded market growth of 2% in 2025. Warom's relative market share in this non-core, highly fragmented segment is below 1%. Revenue contribution from this unit has fallen to 2% of consolidated sales. Gross margin has compressed to 9% due to price competition from mass-market manufacturers. CAPEX has been curtailed to near-zero to avoid further capital erosion; maintenance R&D and production sustainment are minimal.
| Metric | Value |
|---|---|
| Market growth (2025) | 2% |
| Warom market share | <1% |
| Revenue contribution | 2% of total sales |
| Gross margin | 9% |
| CAPEX | Minimal / ceased for expansion |
| Strategic status | Non-core, candidate for exit/harvest |
Legacy Analog Monitoring Panels: demand for legacy analog safety monitoring systems is declining at -9% annually as customers migrate to digital cloud-native platforms. Warom's share in this shrinking market has declined markedly; the segment now represents 3% of group sales, down from 8% three years prior. Operating margin has fallen to 5%, and unit ROI has reached approximately 3%, below the company's weighted average cost of capital, leading management to plan a controlled phase-out.
- Three-year revenue decline: 62.5% (from 8% to 3% of total sales)
- Annual market decline: -9%
- Current operating margin: 5%
- ROI: 3%
- Planned action: gradual phase-out, support contracts for existing installed base
| Metric | Value |
|---|---|
| Market growth | -9% p.a. |
| Warom market share | Declining (notable erosion vs. digital providers) |
| Revenue contribution | 3% of total sales (current) |
| Operating margin | 5% |
| ROI | 3% |
| Capital allocation | Maintenance-only; no strategic investments |
Generic Non Hazardous Industrial Hardware: the market for standard non-explosion-proof industrial hardware is effectively flat at 1% growth. Warom's share in this commoditized sector is 1.5%, contributing only 2% of corporate revenue. Net margins are under pressure at 4%, and the unit provides no meaningful strategic synergy with Warom's core safety and explosion-proof product lines. Capital investment has been reduced to zero while resources are reallocated to high-value safety niches.
- Market growth (2025): 1%
- Warom market share: 1.5%
- Revenue share: 2% of total
- Net margin: 4%
- CAPEX: 0 (reallocated)
- Strategic fit: low
| Metric | Value |
|---|---|
| Market growth | 1% |
| Warom market share | 1.5% |
| Revenue contribution | 2% of total sales |
| Net margin | 4% |
| CAPEX | Zero |
| Strategic recommendation | Divest or harvest; redeploy resources to core explosion-proof/safety segments |
Disclaimer
All information, articles, and product details provided on this website are for general informational and educational purposes only. We do not claim any ownership over, nor do we intend to infringe upon, any trademarks, copyrights, logos, brand names, or other intellectual property mentioned or depicted on this site. Such intellectual property remains the property of its respective owners, and any references here are made solely for identification or informational purposes, without implying any affiliation, endorsement, or partnership.
We make no representations or warranties, express or implied, regarding the accuracy, completeness, or suitability of any content or products presented. Nothing on this website should be construed as legal, tax, investment, financial, medical, or other professional advice. In addition, no part of this site—including articles or product references—constitutes a solicitation, recommendation, endorsement, advertisement, or offer to buy or sell any securities, franchises, or other financial instruments, particularly in jurisdictions where such activity would be unlawful.
All content is of a general nature and may not address the specific circumstances of any individual or entity. It is not a substitute for professional advice or services. Any actions you take based on the information provided here are strictly at your own risk. You accept full responsibility for any decisions or outcomes arising from your use of this website and agree to release us from any liability in connection with your use of, or reliance upon, the content or products found herein.