
|
China Galaxy Securities Co., Ltd. (6881.HK): PESTLE Analysis [Apr-2026 Updated] |
Entièrement Modifiable: Adapté À Vos Besoins Dans Excel Ou Sheets
Conception Professionnelle: Modèles Fiables Et Conformes Aux Normes Du Secteur
Pré-Construits Pour Une Utilisation Rapide Et Efficace
Compatible MAC/PC, entièrement débloqué
Aucune Expertise N'Est Requise; Facile À Suivre
China Galaxy Securities Co., Ltd. (6881.HK) Bundle
China Galaxy Securities combines the muscle of state backing and rapid AUM and investment-banking growth with cutting‑edge AI, blockchain and cloud capabilities, positioning it as a national champion in domestic and Belt‑and‑Road markets; yet it faces rising compliance, data‑localization and geopolitical costs that squeeze margins even as demographic shifts, wealth migration to capital markets, ASEAN regulatory openings and booming green finance create clear avenues for profitable expansion-read on to see how these forces shape its next phase.
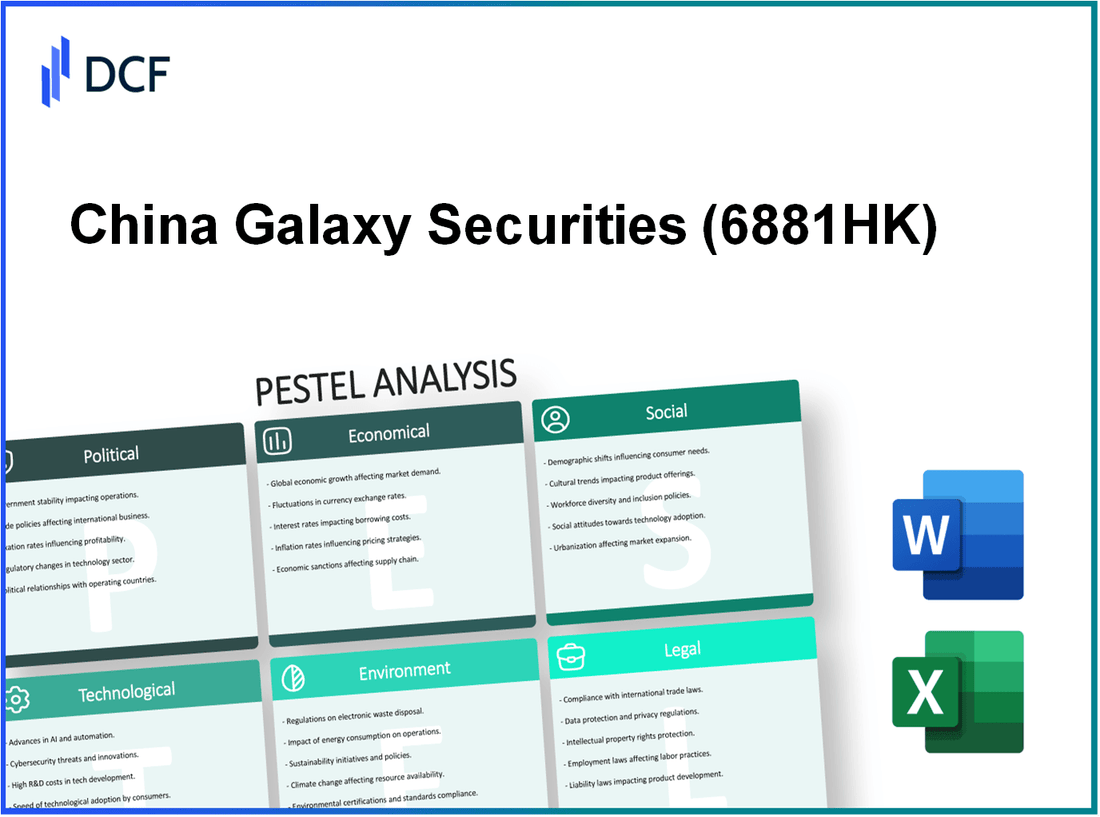
China Galaxy Securities Co., Ltd. (6881.HK) - PESTLE Analysis: Political
State ownership aligns the firm with national strategic goals.
China Galaxy Securities operates within a governance structure where state-affiliated shareholders and policy banks exercise strategic influence, enabling alignment with macroeconomic and industrial policies such as capital market deepening, financial inclusion, and strategic sector financing. This alignment frequently translates into preferential access to state-sponsored initiatives (asset management mandates, municipal bond underwriting, SOE reform advisory) and mitigates political risk in large domestic transactions.
| Political Feature | Operational Effect | Representative Metric / Evidence |
|---|---|---|
| State-affiliated ownership and influence | Priority in policy-directed underwriting and advisory roles; closer coordination with regulators | Presence of state-owned institutional shareholders; participation in SOE reform deals and state bond syndicates |
| Policy-driven capital deployment | Pipeline of guaranteed or semi-guaranteed mandates; strategic business units aligned to national priorities | Allocation to policy projects, inclusion in government-led financing consortia |
Cross-border regulatory pacts expand market access.
Multilateral and bilateral capital market linkages - notably Stock Connect (Shanghai-Hong Kong launched Nov 2014; Shenzhen-Hong Kong launched Dec 2016) and Bond Connect (launched Jul 2017) - have materially increased China Galaxy's addressable client base and product distribution channels. These pacts enable onshore brokers to service foreign investor flows, expand QDII/QFII-related product offerings and grow custody, settlement and prime brokerage services for international institutions.
- Stock Connect dates: Nov 2014 (Shanghai-HK), Dec 2016 (Shenzhen-HK)
- Bond Connect launch: Jul 2017
- Key regulatory liberalization event: removal/reform of some foreign investment quota regimes (notably 2019-2020 adjustments)
| Cross-border Mechanism | Market Access Effect | Quantitative Indicator |
|---|---|---|
| Stock Connect | Direct northbound/southbound equity flows; increased foreign participation in A-shares | Operational since 2014/2016; daily northbound/southbound turnover spikes on major announcements |
| Bond Connect | Foreign investor access to onshore bond market; growth in custody and bond trading volumes | Operational since 2017; incremental foreign holdings in CNY bonds year-on-year |
Data localization and security oversight shape cross-border operations.
Regulatory requirements on data protection, cross-border data transfer approvals and cybersecurity reviews (notably since the enactment and enforcement of the Cybersecurity Law and subsequent data security measures) require China Galaxy to maintain onshore data storage for client and transaction data, implement security-review processes for cross-border IT projects, and potentially segregate international data flows. These rules increase compliance and IT costs and impose lead times on global product launches.
- Regulatory drivers: Cybersecurity Law (effective 2017) and subsequent data security / personal information protection frameworks
- Operational impacts: onshore data centers, third-party vendor due diligence, security-review timelines (weeks to months)
| Requirement | Practical Impact | Typical Quantified Effect |
|---|---|---|
| Onshore data localization | Local storage and processing of client/transaction data | Incremental IT infrastructure and OPEX; multi-month implementation timelines for major projects |
| Security reviews for cross-border transfers | Approval delays; potential redesign of products involving foreign counterparties | Project lead-time increases (e.g., +8-16 weeks for major transfers) |
Financial system reform concentrates brokerage leadership and growth.
Ongoing reform of China's financial markets (liberalization of institutional access, consolidation incentives, enhanced risk-control regime) has favored large integrated brokerages. Regulatory emphasis on capital adequacy, risk management and standardized margin and clearing practices tends to advantage better-capitalized firms such as China Galaxy, enabling market-share gains in underwriting, fixed-income distribution and wealth management as smaller, undercapitalized competitors consolidate or exit.
- Regulatory focus: stronger capital & risk requirements, market-maker incentives, greater institutional investor participation
- Market outcome: concentration among top-tier brokerages; scale advantages in underwriting and fixed-income distribution
| Reform Element | Effect on Brokerage Landscape | Observable Metric |
|---|---|---|
| Capital and risk standards | Higher barriers to entry; favors large, well-capitalized firms | Relative ranking shifts in underwriting league tables; consolidation of market share among top 5-10 firms |
| Promoting institutional investors | Growth in fee-based wealth & asset-management business | Increase in institutional AUM and brokerage fee income streams |
Diplomatic tensions influence capital flows and compliance costs.
Geopolitical frictions (trade disputes, sanctions risks, export controls on technology, and diplomatic tensions between China and major financial jurisdictions) create episodic volatility in cross-border capital flows, raise compliance burdens for international products and counterparties, and can lead to restricted access to certain foreign markets or services. These factors affect revenue volatility in international business lines and require enhanced legal and sanctions-screening capabilities.
- Operational consequences: elevated compliance headcount; enhanced transaction screening; scenario planning for sanctions/dual-use control events
- Financial consequences: episodic reductions in cross-border trading volumes, increased compliance costs (measurable as rising percentage of G&A allocated to compliance)
| Geopolitical Factor | Business Impact | Quantitative Signal |
|---|---|---|
| Sanctions and export controls | Restricted product/service access; need for enhanced compliance | Compliance-related cost increases; periodic reductions in cross-border revenue segments |
| Capital flow volatility from diplomatic flare-ups | Temporary outflows or inward flow slowdowns; margin and liquidity pressure | Spikes in net capital flow volatility; trading volume declines during peak tension episodes |
China Galaxy Securities Co., Ltd. (6881.HK) - PESTLE Analysis: Economic
Accommodative monetary policy boosts market liquidity
China's 2024-25 monetary stance has remained relatively accommodative, with the PBOC maintaining medium-term lending facility (MLF) rates near 2.75% and one-year loan prime rate (LPR) around 3.65% for most of 2024. Low policy rates and reserve requirement ratio (RRR) cuts (cumulative RRR easing of ~150 bps since 2022) have increased system liquidity, supporting higher daily turnover on A-share markets (average daily trade value on Shanghai/Shenzhen exchanges rose to approximately RMB 1.1-1.3 trillion in 2024). For China Galaxy Securities, this has translated into elevated brokerage commissions and higher margin financing balances, with daily margin financing outstanding across the market peaking near RMB 1.5 trillion in volatile sessions.
Wealth shift to capital markets drives asset growth
Household and institutional savings continue reallocating from deposits and real estate into capital markets. Retail participation increased: new retail investor accounts on mainland exchanges expanded by roughly 8-12% year-on-year in 2024, while mutual fund AUM in China grew by ~18% YoY to exceed RMB 22 trillion. China Galaxy's asset management and wealth management units benefited-firm AUM rose an estimated mid-teens percentage in 2024, contributing materially to fee-based revenue growth. Key drivers include rising ETF adoption (ETF AUM up ~25% YoY) and structured product issuance, where the firm captured notable market share.
RMB stability protects international revenue streams
The RMB traded in a relatively narrow band against the USD in 2024-25, with USD/CNY averaging ~7.1 and daily volatility lower than 2022-23 peaks. Stable onshore-offshore spreads and controlled capital flows have mitigated FX translation risks for China Galaxy's cross-border business (custody, QFII/RQFII flows, and Hong Kong listings support). The firm's international commission and underwriting fees-linked to Hong Kong trading volumes and cross-border deals-saw limited FX-driven erosion, preserving foreign-currency-equivalent revenues for the parent entity.
Economic recovery fuels investment banking activity
Mainland GDP growth rebounded to ~5.2% in 2024 following policy support and consumption recovery. Corporate balance sheet normalization and an uptick in capex and M&A drove demand for ECM and DCM services. Equity issuance onshore and in Hong Kong increased: total IPO proceeds in Greater China rose ~30% YoY in 2024, while bond issuance (corporate and financial) expanded ~12% YoY. China Galaxy's investment banking fees reflected this trend-ECM underwriting revenue improved substantially, and advisory mandates increased both in number and average deal size.
Trade and investment cycles influence brokerage profitability
Global trade cycles and domestic export performance affect cyclical sectors and market breadth, altering commission and underwriting pipelines. Export growth moderated to mid-single digits in 2024, impacting industrial and commodity-linked trading volumes. Brokerage profitability shows sensitivity to these cycles through three channels:
- Trading commissions and market-making spreads-higher in bullish, high-volatility regimes; reduced in range-bound markets.
- Proprietary trading and principal investments-returns correlated with market liquidity and macro volatility; realized gains/losses swing year-to-year.
- Underwriting and advisory pipeline-tied to cyclical capex and cross-border M&A activity.
| Macro/Market Indicator | 2024 Value / Change | Implication for China Galaxy |
|---|---|---|
| China GDP growth | ~5.2% YoY | Boost to underwriting and advisory deal flow |
| PBOC one-year LPR | ~3.65% | Lower financing cost; higher margin lending activity |
| Daily A-share turnover | RMB 1.1-1.3 trillion (avg.) | Higher brokerage commission revenue |
| Retail investor account growth | +8-12% YoY | Expanded client base for wealth products |
| Mutual fund AUM (China) | ~RMB 22 trillion (+18% YoY) | Increased asset management fees |
| ETF AUM growth | ~+25% YoY | Higher passive product distribution revenue |
| RMB vs USD (avg) | ~7.1 | Limited FX translation risk for cross-border fees |
| IPO proceeds (Greater China) | +30% YoY | Stronger ECM fees and underwriting volumes |
| Corporate bond issuance | +12% YoY | Expanded DCM opportunities |
China Galaxy Securities Co., Ltd. (6881.HK) - PESTLE Analysis: Social
China's demographic and social shifts materially reshape demand and distribution of securities, wealth management and brokerage services offered by China Galaxy Securities (CGS). The following sociological factors highlight quantifiable trends and direct implications for CGS's product mix, distribution strategy, and client segmentation.
Aging population boosts demand for private pension products. China's population aged 65+ was roughly 13-14% in the early 2020s and is projected to rise toward 17%-20% by 2030 in many forecasts. The aging trend increases demand for annuities, guaranteed-income products, conservative fixed-income portfolios and managed retirement solutions. For CGS, this translates into an expanding addressable market for private pension and wealth-preservation solutions:
| Metric | Value / Estimate | Relevance to CGS |
|---|---|---|
| Population aged 65+ | ~13-14% (2020s); projected 17-20% by 2030 | Rising long-term demand for retirement-focused products and fee-based AUM |
| Private pension market size (China) | Estimated >RMB 3-5 trillion in investable assets (growing double-digits annually) | Opportunity to scale advisory, third‑party distribution and proprietary pension funds |
| Average fee margin (pension / advisory) | Typically 0.3%-1.5% annual advisory/AUM fees | Revenue diversification away from commission-driven brokerage |
Digital natives dominate and accelerate mobile trading. Retail participation has surged: mobile/online channels now account for the majority of new brokerage account openings and trade executions. Industry reports indicate mobile platforms represent an estimated 75%-90% of retail trades by volume in recent years. CGS must prioritize mobile UX, real-time data, algorithmic retail products and low-latency execution to retain and grow market share.
- Retail accounts growth: annual new retail investor accounts in China numbered tens of millions post-2019 market reopening.
- Mobile trade share: ~75%-90% of retail trades executed on mobile apps (industry estimate, 2022-2024).
- Average trade size: smaller per-trade tickets but higher frequency from Gen Y/Z clients.
Urbanization concentrates wealth in mega-cities. China's urbanization rate is ~60%-65% (early 2020s), with top-tier cities (Beijing, Shanghai, Guangzhou, Shenzhen) concentrating a disproportionate share of high-net-worth individuals (HNWIs) and investable assets. Wealth concentration increases the efficiency of targeted branch networks, wealth centers and private-banking teams for CGS while necessitating premium service tiers in those hubs.
| Metric | Value | Implication for CGS |
|---|---|---|
| Urbanization rate | ~60%-65% (early 2020s) | Higher retail and HNWI density in cities; branch/service concentration effective |
| Share of HNWIs in top-tier cities | Estimated majority (>50%-70%) clustered in top 1-10 cities | Need for tailored wealth management teams and localized product suites |
| Average investable assets per HNWI | Varies widely; typically >RMB 10 million for HNWI segment | Potential for higher-fee bespoke services and structured products |
Higher education drives sophisticated investment behavior. Enrollment in tertiary education has expanded substantially: gross tertiary enrollment ratio reached ~50%+ in the 2020s. A more educated investor base increasingly demands advanced products (derivatives, structured notes, cross-border access), quantitative insights and research-driven recommendations. For CGS, this shifts margin potential toward fee-based advisory, research monetization, structured products and securities lending.
- Gross tertiary enrollment: ~50%+ (early 2020s).
- Proportion of retail investors seeking derivatives/leveraged products: rising year-on-year; percentage varies by cohort but notable among educated urban traders.
- Demand for on-platform research and proprietary models: increased willingness to pay for premium analytics among educated clients.
Education-driven literacy expands participation in financial markets. Financial literacy initiatives, university finance programs and fintech education have increased investor sophistication and market participation. The retail investor base now includes more informed participants using ETFs, mutual funds and discretionary mandates. This trend expands CGS's potential AUM and fee pools while raising client expectations for compliance, transparency and investor protection.
| Metric | Trend / Figure | Consequence for CGS |
|---|---|---|
| Financial literacy & education programs | Expanded public and private programs; higher awareness among 20-40 age cohort | Higher uptake of fund products, ETFs, and advisory services |
| Retail investor participation rate in equity markets | Significant growth since 2015; millions of active retail accounts | Larger fee and commission base, but increased competition and price sensitivity |
| Household financial assets | Rising nominally (trillions RMB); shift from cash/deposits into capital markets | Opportunity to convert deposits into securities and wealth products |
China Galaxy Securities Co., Ltd. (6881.HK) - PESTLE Analysis: Technological
AI enhances research productivity and client service: China Galaxy Securities has expanded AI deployment across equity research, credit analysis and wealth management advisory, reporting a 35-50% reduction in analyst time for routine data aggregation and report drafting since 2022. Proprietary natural language processing models accelerate earnings-note generation; recommendation engines personalize model portfolios for >1.2 million retail clients, increasing client engagement metrics by ~18% and advisory conversion rates by ~9% year-over-year.
Digital yuan and blockchain shorten settlement times: Pilot integration with central bank digital currency (CBDC) and trade-finance blockchain initiatives reduced inter-party settlement and cash-transfer latencies in selected fixed-income and institutional prime-brokerage workflows from T+2/T+1 to near real-time for pilot cases. The firm estimates potential working capital savings of CNY 2-4 billion annually if blockchain-enabled settlement scales to 20-30% of institutional trading volume; internal pilots settled >CNY 150 million in pilot transactions in 2024.
Cybersecurity spend grows to counter rising threats: Annual cybersecurity expenditures rose to ~CNY 180-260 million (a ~28% increase vs. 2021) to support SOC operations, endpoint protection, penetration testing and regulatory compliance. The firm reports mean time to detect (MTTD) improvement from 72 hours to under 12 hours and mean time to remediate (MTTR) from 7 days to under 48 hours after investment. Regulatory fines and breach-cost avoidance are modeled at up to CNY 120 million in downside risk mitigated annually.
Cloud adoption improves scalability and speed: Cloud migration of trading analytics, client portals and back-office processing reached ~60% of non-sensitive workloads by 2024, enabling on-demand compute scaling during volatility spikes (up to 4x capacity during peak market hours). Cloud-enabled downtime fell by 75% for customer-facing systems; infrastructure cost optimization yielded projected OPEX savings of ~12-16% relative to fully on-premises baselines. Hybrid architecture maintains ~40% of workloads on private infrastructure for regulatory and latency-critical functions.
Data integrity and real-time analytics underpin risk management: Investment in real-time data lakes, streaming analytics and unified reference data has enabled mark-to-market risk, liquidity and counterparty exposures to be measured with minute-level granularity across >50 asset classes. Value-at-Risk (1-day, 99%) monitoring latency decreased from ~30 minutes to under 5 minutes. Data governance initiatives reduced data reconciliation exceptions by ~85% and improved capital allocation efficiency-projected reduction in incremental capital charges of CNY 0.6-1.1 billion annually under stressed scenarios.
| Technology Area | Key Metric/Change | 2021 Baseline | 2024 Level | Estimated Financial Impact (Annual) |
|---|---|---|---|---|
| AI-driven research | Analyst time saved | 0% | 35-50% | Efficiency gain ≈ CNY 45-80 million |
| CBDC/blockchain pilots | Pilot settlement volume | - | CNY 150 million | Working capital savings CNY 2-4 billion (if scaled) |
| Cybersecurity | Annual spend | CNY 140-200 million | CNY 180-260 million | Risk mitigation up to CNY 120 million |
| Cloud adoption | % workloads migrated | ~20% | ~60% | OPEX savings 12-16% |
| Real-time analytics | Risk monitoring latency | ~30 minutes | <5 minutes | Capital charge reduction CNY 0.6-1.1 billion |
Key technology initiatives:
- Deploy generative and predictive AI for report automation, trade idea generation and client personalization.
- Scale CBDC and permissioned blockchain settlement pilots with clearing partners to reduce settlement cycle risk.
- Increase cybersecurity maturity: SOC 24/7, threat intelligence sharing, red-team exercises and regulatory compliance automation.
- Expand hybrid cloud footprint with cloud-native low-latency trading stacks and private-cloud for regulated data.
- Strengthen data governance: master data management, real-time streaming, and reconciliation automation to support risk and capital efficiency.
China Galaxy Securities Co., Ltd. (6881.HK) - PESTLE Analysis: Legal
Registration-based IPOs: China's shift from an approval to a registration-based IPO system (piloted on the STAR Market in 2019-2020 and progressively expanded to ChiNext and other boards through 2021-2023) streamlines listings and places greater emphasis on issuer disclosures and market-based pricing mechanisms. For China Galaxy Securities (6881.HK) as an underwriter, sponsor and principal market participant, this increases diligence obligations, disclosure review workloads and potential liability exposure for misstatements. Industry practice has seen underwriting documentation volumes increase by an estimated 15-30% and due diligence timelines compress while requiring more standardized and comprehensive disclosure checklists.
Anti-Money Laundering (AML) reforms: Recent AML regulatory tightening-driven by amendments, PBOC/CBIRC/CSRC circulars and enhanced cross-border monitoring-raises transaction monitoring, KYC and suspicious activity reporting requirements for securities firms. For China Galaxy Securities this translates into higher compliance operating expenses, expanded transaction analytics, and intensified reporting to regulatory authorities. Industry estimates put incremental AML compliance costs for large brokerages at between 10%-25% of existing compliance budgets, with failure to comply exposing firms to administrative fines, license restrictions, and reputational sanctions.
Data privacy and personal information protection laws: The Personal Information Protection Law (PIPL, effective November 2021) and related regulations impose stringent obligations on handling, storing and transferring personal data. Key exposures for China Galaxy Securities include requirements for lawful basis for processing client data, explicit cross-border data transfer mechanisms, data minimization and enhanced breach notification timelines. Statutory penalties under PIPL can reach RMB 50 million or up to 5% of the firm's annual turnover in the previous year for serious violations, elevating legal and operational risk. The need for encryption, segregation of client data and audited consent records increases IT and legal expenditures-internal estimates across the sector indicate one‑off implementation costs ranging from RMB 10-100 million for large financial institutions depending on legacy systems.
Hong Kong listing rules and cross-border governance: For a dual/listed issuer or a firm with Hong Kong operations, HKEX's continuous tightening of listing rules and corporate governance expectations (enhanced disclosure, sponsor liability, independent director standards and sponsor due diligence) increases compliance complexity. Since 2020 HKEX has issued reforms targeting sponsor competency, IPO timeline management and ESG/climate disclosure alignment. For China Galaxy Securities, compliance requires strengthened internal controls, expanded disclosure teams and potentially higher sponsor capital and indemnity arrangements. Sanctions for breaches in Hong Kong can include public censure, fines (HKD millions) and suspension of listing-related activities.
Mandatory climate and ESG disclosures: Regulatory momentum in mainland China and Hong Kong is translating into mandatory sustainability-related disclosures for listed companies. CSRC and HKEX consultations and rules progressively require climate-related risk disclosure, board-level oversight and metrics reporting (GHG scopes, transition plans). For China Galaxy Securities, this imposes new obligations as a listed firm (and as adviser/sponsor to issuers): collection of emissions data, scenario analysis, and assurance-ready reporting. Costs include staff hiring (sustainability officers), external assurance fees and system upgrades. Market expectations and regulatory timelines mean full compliance programs are often budgeted across 12-24 months following rule finalization.
Key legal impacts, timelines and quantitative implications:
| Legal Change | Effective / Implementation Timeline | Direct Impacts on China Galaxy Securities | Estimated Quantitative Implications |
|---|---|---|---|
| Registration-based IPO regime (mainland expansion) | Pilots 2019-2020; phased expansion 2021-2023; ongoing refinement | Higher disclosure workload; increased underwriting diligence; greater liability exposure | Due diligence/documentation volumes +15-30%; IPO timelines standardized; potential legal costs per deal increased |
| AML reforms and enhanced monitoring | Ongoing reforms since 2017; intensified 2020-present | Expanded KYC, STR filings, transaction monitoring and staff training | Compliance budget increase +10-25%; potential fines and sanctions (administrative penalties, range varies by violation) |
| PIPL and data protection regime | PIPL effective Nov 2021; implementing rules phased thereafter | Data governance overhaul, consent management, cross-border transfer assessments | Fines up to RMB 50M or 5% annual revenue; one‑off IT/legal costs commonly RMB 10-100M for large firms |
| HKEX listing rule tightening | Series of rule changes 2020-2024; incremental enforcement ongoing | Stricter sponsor obligations, enhanced disclosure, governance upgrades | Potential fines in HKD millions; increased sponsor liability and operational costs for listing activities |
| Mandatory climate & ESG disclosures | Phased mandates and enhanced expectations 2021-2024; continuing alignment with international standards | New reporting, assurance readiness, board oversight and metric collection | Implementation timelines 12-24 months; recurring costs: sustainability staff, assurance and data systems (typical budgets vary by firm size) |
Compliance and legal mitigation actions typically adopted:
- Revise and expand prospectus, disclosure and due diligence checklists to meet registration-based IPO standards.
- Invest in transaction monitoring systems, automated KYC/CDD tools and staff training to meet AML requirements.
- Implement PIPL-compliant data governance: DPIAs, record-keeping, cross-border transfer mechanisms, encryption and breach-response playbooks.
- Enhance HK corporate governance practices, sponsor frameworks and disclosure controls to align with HKEX requirements.
- Develop climate/ESG data collection, adopt reporting frameworks (TCFD/SASB/ESG), and plan for third-party assurance.
China Galaxy Securities Co., Ltd. (6881.HK) - PESTLE Analysis: Environmental
Green finance mandates channel credit to sustainable projects
China's policy drive directs financial institutions to allocate capital to green and low‑carbon projects. National policies (Green Credit Guidelines 2012 and subsequent updates) and local regulators require banks and securities firms to support green bond underwriting, green loans and sustainable investment products. By end‑2023 China's cumulative green bond issuance exceeded RMB 3.0 trillion and outstanding green loans across major banks were estimated in excess of RMB 10-15 trillion, creating substantial underwriting, advisory and asset‑management opportunity for China Galaxy Securities (CGS). Market participation metrics relevant to CGS:
| Metric | Value / Date | Implication for CGS |
|---|---|---|
| China cumulative green bond issuance | ≈ RMB 3.0 trillion (end‑2023) | High pipeline for underwriting & syndication fees |
| Outstanding green loans (major banks) | ≈ RMB 10-15 trillion (2023 estimate) | Secondary market and advisory demand; cross‑sell opportunities |
| Green credit guidance issuance | 2012, updated periodically through 2022-2023 | Regulatory mandate to expand green product offerings |
Carbon neutrality aims reshape corporate strategy and operations
China's national target-peak CO2 by around 2030 and carbon neutrality by 2060-forces corporate clients and financial institutions to revise strategies. For CGS this translates into: prioritizing capital markets services for renewable energy, clean transportation, energy efficiency and electric vehicle supply chain companies; shifting research coverage to low‑carbon sectors; and adjusting balance‑sheet allocations to limit exposure to high‑emissions industries. Quantitative signals:
- Target year: Peak ≈ 2030; neutrality by 2060
- Proportion of China's industrial emissions covered by national ETS: initially >40% (power sector)
- Renewable capacity additions: China added >120 GW wind/solar in 2022-2023 (annual scale)
Mandatory ESG disclosure reframes reporting and investor decisions
Regulators in mainland China and Hong Kong have progressively tightened mandatory ESG disclosure for listed firms and financial institutions. HKEX's ESG rules (phased from 2020) and CSRC‑led disclosure expectations raise demand for ESG research, compliance advisory and ESG‑labelled products. For CGS this raises recurring revenue potential from ESG ratings, report production and compliance services while increasing costs for internal data, staff and systems. Relevant statistics and operational impacts:
| Requirement | Scope / Timing | Operational impact on CGS |
|---|---|---|
| HKEX mandatory climate disclosures | Phased requirements since 2020; climate reporting for premium‑listed issuers | Demand for Hong Kong‑listed client advisory and disclosure assurance |
| Mainland ESG guidance | CSRC guidance and exchange rules, strengthened 2021-2023 | Increased need for ESG research, product labelling and compliance teams |
| Investor ESG allocation trends | Institutional flows to ESG funds growing ~20-40% YoY in some segments (2021-2023) | Higher AUM potential for CGS asset management ESG products |
Environmental risk management governs large-scale lending and underwriting
Environmental risk-stranded assets, regulatory phase‑outs, physical climate damage-affects creditworthiness of corporate clients. Credit and underwriting policies are increasingly required to integrate climate scenario analysis and transition risk stress testing. Key risk parameters and potential exposures for CGS:
- High‑carbon sectors (coal, heavy industry) face regulatory curtailment: loan exposure repricing required
- Physical climate risk (flooding, typhoons) increases credit loss probabilities for property and infrastructure borrowers in vulnerable regions
- Stress test scenarios: transition shock (rapid policy tightening) and physical shock (extreme weather event) used to model impairment
| Risk type | Typical indicator | Action for CGS |
|---|---|---|
| Transition risk | Emission intensity (tCO2/RMB revenue) | Screen underwriting; price risk into spreads; limit exposures |
| Physical risk | Geographic hazard index / asset replacement cost | Adjust collateral, stress test loan books, require insurance |
| Reputational risk | ESG controversy scores | Enhance due diligence on IPO and M&A clients |
Carbon pricing and credit markets influence investment choices
China's national ETS launched in 2021 (initial coverage: power sector) and regional pilots established carbon pricing experience. Carbon price levels observed in regional pilots historically ranged from RMB 20-100/ton; national market initial prices clustered around RMB 40-70/ton in early trading periods (2021-2023). The growth of voluntary carbon markets and corporate net‑zero purchasing programs creates trading, advisory and structuring business lines for securities firms. Financial implications for CGS:
- Carbon price sensitivity: A ¥50/ton carbon price alters utility and heavy industry margins materially and revalues associated equity and credit instruments
- Volume potential: China ETS trading turnover reached tens of billions RMB annually in active years (growing from pilot to national stage)
- Product opportunities: carbon credits trading desks, structured products, hedging solutions and carbon finance advisory services
Disclaimer
All information, articles, and product details provided on this website are for general informational and educational purposes only. We do not claim any ownership over, nor do we intend to infringe upon, any trademarks, copyrights, logos, brand names, or other intellectual property mentioned or depicted on this site. Such intellectual property remains the property of its respective owners, and any references here are made solely for identification or informational purposes, without implying any affiliation, endorsement, or partnership.
We make no representations or warranties, express or implied, regarding the accuracy, completeness, or suitability of any content or products presented. Nothing on this website should be construed as legal, tax, investment, financial, medical, or other professional advice. In addition, no part of this site—including articles or product references—constitutes a solicitation, recommendation, endorsement, advertisement, or offer to buy or sell any securities, franchises, or other financial instruments, particularly in jurisdictions where such activity would be unlawful.
All content is of a general nature and may not address the specific circumstances of any individual or entity. It is not a substitute for professional advice or services. Any actions you take based on the information provided here are strictly at your own risk. You accept full responsibility for any decisions or outcomes arising from your use of this website and agree to release us from any liability in connection with your use of, or reliance upon, the content or products found herein.