
|
Sino-Synergy Hydrogen Energy (9663.HK) DCF Valuation |
Entièrement Modifiable: Adapté À Vos Besoins Dans Excel Ou Sheets
Conception Professionnelle: Modèles Fiables Et Conformes Aux Normes Du Secteur
Pré-Construits Pour Une Utilisation Rapide Et Efficace
Compatible MAC/PC, entièrement débloqué
Aucune Expertise N'Est Requise; Facile À Suivre
Sino-Synergy Hydrogen Energy (9663.HK) Bundle
Whether you're an investor or analyst, this (9663HK) DCF Calculator is your go-to resource for accurate valuation. Preloaded with Sino-Synergy Hydrogen Energy's real data, you can adjust forecasts and observe the effects in real-time.
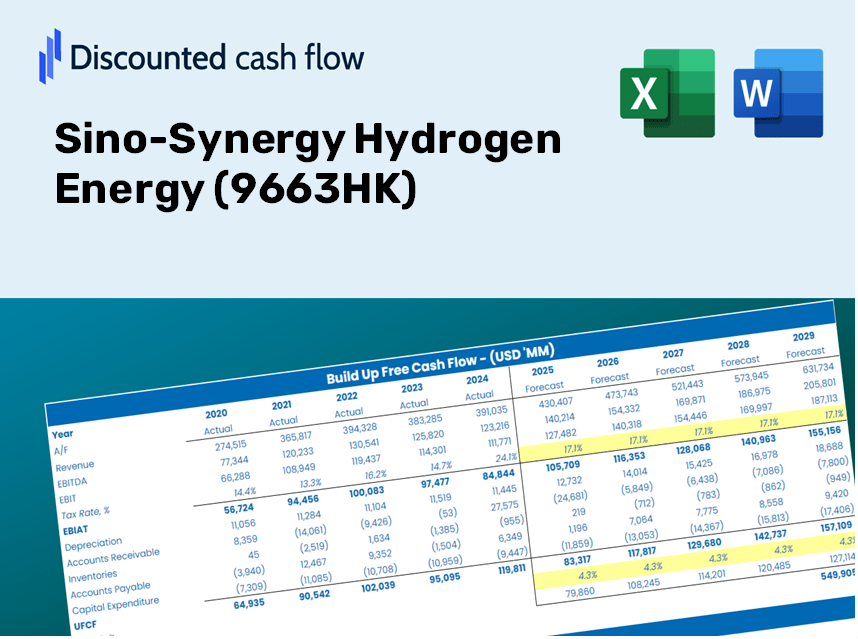
Discounted Cash Flow (DCF) - (USD MM)
| Year | AY1 2020 |
AY2 2021 |
AY3 2022 |
AY4 2023 |
AY5 2024 |
FY1 2025 |
FY2 2026 |
FY3 2027 |
FY4 2028 |
FY5 2029 |
|---|---|---|---|---|---|---|---|---|---|---|
| Revenue | 257.9 | 519.7 | 850.8 | 796.4 | 502.9 | 654.4 | 851.6 | 1,108.1 | 1,441.8 | 1,876.1 |
| Revenue Growth, % | 0 | 101.49 | 63.73 | -6.39 | -36.85 | 30.12 | 30.12 | 30.12 | 30.12 | 30.12 |
| EBITDA | -187.3 | -721.8 | -279.4 | -394.8 | -386.3 | -434.3 | -565.2 | -735.4 | -956.9 | -1,245.1 |
| EBITDA, % | -72.62 | -138.9 | -32.83 | -49.57 | -76.81 | -66.37 | -66.37 | -66.37 | -66.37 | -66.37 |
| Depreciation | 38.8 | 39.8 | 37.0 | 89.8 | 69.5 | 68.2 | 88.8 | 115.6 | 150.4 | 195.6 |
| Depreciation, % | 15.04 | 7.65 | 4.34 | 11.28 | 13.83 | 10.43 | 10.43 | 10.43 | 10.43 | 10.43 |
| EBIT | -226.1 | -761.5 | -316.3 | -484.6 | -455.9 | -492.6 | -640.9 | -834.0 | -1,085.2 | -1,412.1 |
| EBIT, % | -87.66 | -146.55 | -37.18 | -60.85 | -90.64 | -75.26 | -75.26 | -75.26 | -75.26 | -75.26 |
| Total Cash | 532.8 | 809.2 | 830.7 | 1,833.5 | 1,513.2 | 651.3 | 847.5 | 1,102.8 | 1,435.0 | 1,867.3 |
| Total Cash, percent | .0 | .0 | .0 | .0 | .0 | .0 | .0 | .0 | .0 | .0 |
| Account Receivables | 335.6 | 826.0 | 1,310.5 | 1,761.1 | 1,937.5 | 654.4 | 851.6 | 1,108.1 | 1,441.8 | 1,876.1 |
| Account Receivables, % | 130.12 | 158.96 | 154.03 | 221.12 | 385.23 | 100 | 100 | 100 | 100 | 100 |
| Inventories | 247.7 | 441.6 | 431.6 | 320.3 | 267.6 | 425.6 | 553.8 | 720.6 | 937.7 | 1,220.1 |
| Inventories, % | 96.04 | 84.98 | 50.73 | 40.22 | 53.2 | 65.03 | 65.03 | 65.03 | 65.03 | 65.03 |
| Accounts Payable | 44.9 | 115.8 | 580.6 | 879.5 | 900.2 | 403.0 | 524.4 | 682.4 | 887.9 | 1,155.3 |
| Accounts Payable, % | 17.39 | 22.28 | 68.24 | 110.43 | 178.98 | 61.58 | 61.58 | 61.58 | 61.58 | 61.58 |
| Capital Expenditure | -81.7 | -287.1 | -289.0 | -180.5 | -59.2 | -203.3 | -264.5 | -344.2 | -447.9 | -582.8 |
| Capital Expenditure, % | -31.7 | -55.25 | -33.96 | -22.66 | -11.76 | -31.07 | -31.07 | -31.07 | -31.07 | -31.07 |
| Tax Rate, % | 2.14 | 2.14 | 2.14 | 2.14 | 2.14 | 2.14 | 2.14 | 2.14 | 2.14 | 2.14 |
| EBITAT | -216.8 | -770.4 | -294.5 | -449.1 | -446.1 | -472.4 | -614.7 | -799.8 | -1,040.8 | -1,354.2 |
| Depreciation | ||||||||||
| Changes in Account Receivables | ||||||||||
| Changes in Inventories | ||||||||||
| Changes in Accounts Payable | ||||||||||
| Capital Expenditure | ||||||||||
| UFCF | -798.2 | -1,631.2 | -556.2 | -580.0 | -538.8 | 20.4 | -994.4 | -1,293.9 | -1,683.6 | -2,190.7 |
| WACC, % | 8.62 | 8.65 | 8.6 | 8.6 | 8.64 | 8.62 | 8.62 | 8.62 | 8.62 | 8.62 |
| PV UFCF | ||||||||||
| SUM PV UFCF | -4,491.9 | |||||||||
| Long Term Growth Rate, % | 2.00 | |||||||||
| Free cash flow (T + 1) | -2,235 | |||||||||
| Terminal Value | -33,749 | |||||||||
| Present Terminal Value | -22,320 | |||||||||
| Enterprise Value | -26,812 | |||||||||
| Net Debt | 318 | |||||||||
| Equity Value | -27,130 | |||||||||
| Diluted Shares Outstanding, MM | 518 | |||||||||
| Equity Value Per Share | -52.37 |
Discover What You Receive
- Genuine Sino-Synergy Financial Data: Pre-populated with historical and projected figures for in-depth analysis.
- Completely Customizable Template: Easily adjust key metrics such as revenue growth, WACC, and EBITDA %.
- Instantaneous Calculations: Witness real-time updates to Sino-Synergy's intrinsic value as you make changes.
- Expert Valuation Tool: Crafted for investors, analysts, and consultants aiming for precise DCF results.
- Intuitive Design: Streamlined layout and straightforward instructions suitable for all skill levels.
Key Features
- 🔍 Real-Life (9663HK) Financials: Pre-filled historical and projected data for Sino-Synergy Hydrogen Energy.
- ✏️ Fully Customizable Inputs: Modify all essential parameters (yellow cells) such as WACC, growth %, and tax rates.
- 📊 Professional DCF Valuation: Built-in formulas to calculate the intrinsic value of Sino-Synergy using the Discounted Cash Flow method.
- ⚡ Instant Results: Visualize the valuation of Sino-Synergy immediately after any modifications.
- Scenario Analysis: Evaluate and compare outcomes for different financial assumptions in a side-by-side format.
How It Operates
- Download: Obtain the pre-built Excel file featuring Sino-Synergy Hydrogen Energy’s (9663HK) financial metrics.
- Customize: Tailor predictions by modifying key factors such as revenue growth, EBITDA margin, and WACC.
- Update Automatically: Watch as the intrinsic value and NPV calculations refresh in real-time.
- Test Scenarios: Generate various forecasts and instantly compare the results.
- Make Decisions: Leverage the valuation insights to inform your investment approach.
Why Opt for Sino-Synergy Hydrogen Energy (9663HK) Calculator?
- Precision: Leverages authentic Sino-Synergy financial data to guarantee accuracy.
- Adaptability: Built to allow users to easily adjust and test various inputs.
- Efficiency: Eliminate the complexity of creating a DCF model from the ground up.
- High-Quality: Crafted with the expertise expected at the CFO level, ensuring both precision and functionality.
- Intuitive: Designed for effortless use, suitable for individuals without extensive financial modeling skills.
Who Can Benefit from This Product?
- Investors: Evaluate the valuation of Sino-Synergy Hydrogen Energy (9663HK) prior to making stock trades.
- CFOs and Financial Analysts: Optimize valuation methodologies and test future projections.
- Startup Founders: Gain insights into how leading companies like Sino-Synergy Hydrogen Energy (9663HK) are valued.
- Consultants: Provide comprehensive valuation reports for your clients.
- Students and Educators: Utilize real-world data to practice and teach valuation strategies.
Contents of the Template
- Pre-Filled DCF Model: Sino-Synergy Hydrogen Energy’s financial data ready for immediate application.
- WACC Calculator: Comprehensive calculations for the Weighted Average Cost of Capital.
- Financial Ratios: Assess Sino-Synergy’s profitability, leverage, and operational efficiency.
- Editable Inputs: Modify assumptions like growth rates, margins, and capital expenditures to suit your analysis.
- Financial Statements: Access annual and quarterly reports for thorough examination.
- Interactive Dashboard: Effortlessly visualize essential valuation metrics and outcomes.
Disclaimer
All information, articles, and product details provided on this website are for general informational and educational purposes only. We do not claim any ownership over, nor do we intend to infringe upon, any trademarks, copyrights, logos, brand names, or other intellectual property mentioned or depicted on this site. Such intellectual property remains the property of its respective owners, and any references here are made solely for identification or informational purposes, without implying any affiliation, endorsement, or partnership.
We make no representations or warranties, express or implied, regarding the accuracy, completeness, or suitability of any content or products presented. Nothing on this website should be construed as legal, tax, investment, financial, medical, or other professional advice. In addition, no part of this site—including articles or product references—constitutes a solicitation, recommendation, endorsement, advertisement, or offer to buy or sell any securities, franchises, or other financial instruments, particularly in jurisdictions where such activity would be unlawful.
All content is of a general nature and may not address the specific circumstances of any individual or entity. It is not a substitute for professional advice or services. Any actions you take based on the information provided here are strictly at your own risk. You accept full responsibility for any decisions or outcomes arising from your use of this website and agree to release us from any liability in connection with your use of, or reliance upon, the content or products found herein.