
|
Shinko Electric Industries Co., Ltd. (6967.T) DCF Valuation |
Fully Editable: Tailor To Your Needs In Excel Or Sheets
Professional Design: Trusted, Industry-Standard Templates
Investor-Approved Valuation Models
MAC/PC Compatible, Fully Unlocked
No Expertise Is Needed; Easy To Follow
Shinko Electric Industries Co., Ltd. (6967.T) Bundle
Evaluate Shinko Electric Industries Co., Ltd. (6967T) financial outlook like an expert! This (6967T) DCF Calculator provides you with pre-filled financial data and offers full flexibility to modify revenue growth, WACC, margins, and other essential assumptions to align with your projections.
What You Will Receive
- Customizable Excel Template: A fully adaptable Excel-based DCF Calculator featuring pre-loaded financial data for Shinko Electric Industries Co., Ltd. (6967T).
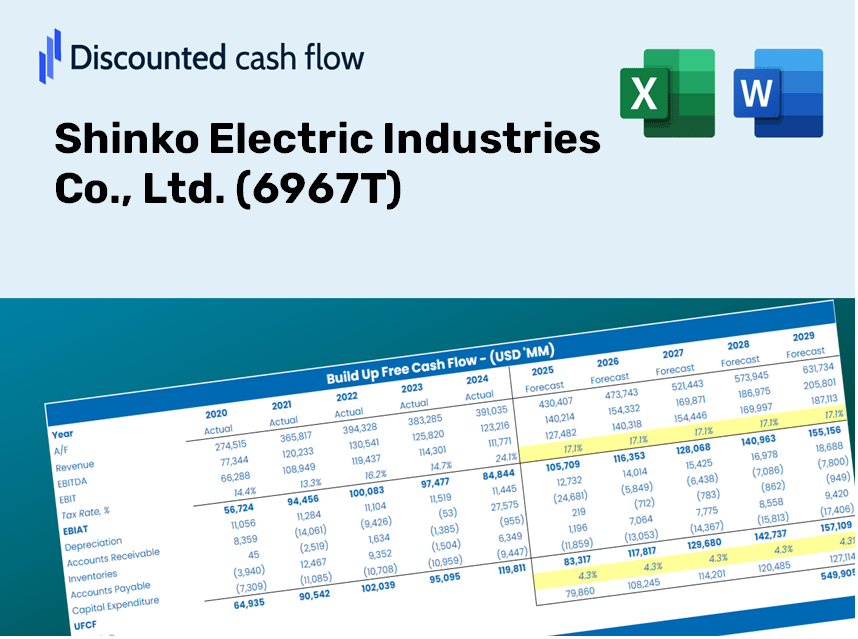
- Accurate Market Data: Access to historical figures and forward-looking projections (highlighted in the yellow cells).
- Forecast Customization: Modify key assumptions such as revenue growth, EBITDA margin, and WACC.
- Instant Calculations: Quickly observe how your inputs influence the valuation of Shinko Electric Industries Co., Ltd. (6967T).
- Professional Grade Tool: Designed for investors, CFOs, consultants, and financial analysts.
- User-Friendly Layout: Organized for simplicity and ease of navigation, complete with step-by-step guidance.
Key Features
- Comprehensive DCF Calculator: Offers detailed unlevered and levered DCF valuation models tailored for Shinko Electric Industries Co., Ltd. (6967T).
- WACC Calculator: Features a pre-built Weighted Average Cost of Capital sheet with adaptable inputs specific to Shinko Electric Industries Co., Ltd. (6967T).
- Customizable Forecast Assumptions: Easily adjust growth rates, capital expenditures, and discount rates relevant to Shinko Electric Industries Co., Ltd. (6967T).
- Integrated Financial Ratios: Evaluate profitability, leverage, and efficiency ratios for Shinko Electric Industries Co., Ltd. (6967T).
- Interactive Dashboard and Charts: Visualizations present key valuation metrics for straightforward analysis concerning Shinko Electric Industries Co., Ltd. (6967T).
How It Works
- Download: Get the pre-formatted Excel file containing Shinko Electric Industries Co., Ltd.'s financial data.
- Customize: Tailor forecasts such as revenue growth, EBITDA %, and WACC to fit your analysis.
- Update Automatically: Watch intrinsic value and NPV calculations refresh in real-time.
- Test Scenarios: Develop various projections and instantly compare the results.
- Make Decisions: Utilize the valuation findings to inform your investment strategies for Shinko Electric Industries Co., Ltd. (6967T).
Why Opt for Shinko Electric Industries Co., Ltd. (6967T)?
- Save Time: Skip the hassle of building a financial model from the ground up – it's ready for use.
- Enhance Accuracy: Access to dependable financial data and formulas minimizes valuation errors.
- Completely Customizable: Adjust the model to align with your specific assumptions and forecasts.
- User-Friendly Insights: Intuitive charts and outputs simplify the analysis of results.
- Endorsed by Professionals: Crafted for experts who prioritize precision and functionality.
Who Can Benefit from This Product?
- Engineering Students: Explore innovative technologies and apply theoretical concepts using real-world data.
- Researchers: Integrate cutting-edge models into academic studies or projects related to the electronics industry.
- Investors: Validate your investment strategies and evaluate financial metrics for Shinko Electric Industries Co., Ltd. (6967T).
- Market Analysts: Enhance your analysis with a ready-to-use, adaptable financial model tailored for the electronics sector.
- Entrepreneurs: Understand the methodologies used to assess large public companies like Shinko Electric Industries Co., Ltd. (6967T).
Contents of the Template
- Pre-Filled Data: Contains historical financials and projections for Shinko Electric Industries Co., Ltd. (6967T).
- Discounted Cash Flow Model: An editable DCF valuation model with automatic calculations included.
- Weighted Average Cost of Capital (WACC): A specific sheet designed for calculating WACC based on your custom inputs.
- Key Financial Ratios: Assess Shinko Electric’s profitability, efficiency, and leverage metrics.
- Customizable Inputs: Easily modify revenue growth, margins, and tax rates.
- Clear Dashboard: Visuals and tables that summarize important valuation outcomes.
Disclaimer
All information, articles, and product details provided on this website are for general informational and educational purposes only. We do not claim any ownership over, nor do we intend to infringe upon, any trademarks, copyrights, logos, brand names, or other intellectual property mentioned or depicted on this site. Such intellectual property remains the property of its respective owners, and any references here are made solely for identification or informational purposes, without implying any affiliation, endorsement, or partnership.
We make no representations or warranties, express or implied, regarding the accuracy, completeness, or suitability of any content or products presented. Nothing on this website should be construed as legal, tax, investment, financial, medical, or other professional advice. In addition, no part of this site—including articles or product references—constitutes a solicitation, recommendation, endorsement, advertisement, or offer to buy or sell any securities, franchises, or other financial instruments, particularly in jurisdictions where such activity would be unlawful.
All content is of a general nature and may not address the specific circumstances of any individual or entity. It is not a substitute for professional advice or services. Any actions you take based on the information provided here are strictly at your own risk. You accept full responsibility for any decisions or outcomes arising from your use of this website and agree to release us from any liability in connection with your use of, or reliance upon, the content or products found herein.