
|
BHP Group Limited (BHP): PESTLE Analysis [Apr-2026 Updated] |
Fully Editable: Tailor To Your Needs In Excel Or Sheets
Professional Design: Trusted, Industry-Standard Templates
Investor-Approved Valuation Models
MAC/PC Compatible, Fully Unlocked
No Expertise Is Needed; Easy To Follow
BHP Group Limited (BHP) Bundle
You're looking for a clear, actionable breakdown of the external forces shaping BHP Group Limited (BHP) right now, and honestly, the landscape is more complex than a simple commodity cycle. The near-term view for BHP is dominated by $4.50 per pound copper demand and a massive 260 to 290 million tonnes iron ore guidance, but new Chilean tax laws and rising OpEx are immediate margin threats. We need to look beyond the balance sheet to see where the real risks and opportunities lie.
Political Factors: Tax Hikes and Geopolitical Headwinds
The political environment is directly hitting BHP's cost structure, so we can't ignore it. The new Chilean mining royalty law, for example, is set to push the total tax burden on their copper operations to nearly 50%. This isn't a future risk; it's a current margin compression that must be modeled immediately.
Plus, the Australian government's 'Closing Loopholes' industrial relations bill adds immediate uncertainty to labor costs, especially around contractor pay. Resource nationalism in places like Peru and Chile is also on the rise, which means project approvals will get tougher. Your iron ore exposure is a direct bet on stable US-China trade dynamics.
Economic Factors: Copper Strength vs. Inflationary Pressure
The good news is copper. The energy transition is keeping prices strong, trading near $4.50 per pound, which is a massive tailwind for Escondida. But honestly, inflation is eating into that gain. Global inflation is driving up operating costs (OpEx) for energy and consumables by an estimated 7-9%, so the gross margin is under pressure even with high commodity prices.
Iron ore is the wild card. BHP's 2025 production guidance is a massive 260 to 290 million tonnes, but the price remains volatile, forecasted between $100 and $120 per tonne. Here's the quick math: a $10 swing in the iron ore price can move billions in revenue, so that volatility is your biggest near-term earnings risk. Copper is the growth story, but iron ore is still the cash cow.
Sociological Factors: Labor Costs and Reputational Risk
Sociological factors are translating directly into labor and reputational risk. Labor shortages persist in Western Australia's Pilbara region, pushing up wage demands and making it harder to hit that 290 million tonnes iron ore target. This isn't just an HR problem; it's an OpEx one.
There is also heightened investor and public pressure for improved Indigenous community engagement, which adds complexity and time to new project approvals. The legacy of the Samarco dam collapse means safety culture remains under intense scrutiny. Plus, public perception against thermal coal is defintely accelerating divestment timelines, potentially forcing a sale at a less-than-optimal price. Social license to operate is now a hard financial constraint.
Technological Factors: Automation as an Inflation Hedge
Technology is BHP's main lever for fighting inflation and labor costs. The expansion of autonomous haulage fleets and drilling across Pilbara operations is a direct move to boost productivity and reduce human error. Think of it as a permanent, non-unionized workforce.
They are also making significant capital expenditure on decarbonization technologies to hit their Scope 1 and 2 emissions reduction targets. Plus, the increased use of Artificial Intelligence (AI) for deep-cover exploration could unlock new, high-grade deposits that traditional methods missed. Digital twin technology is defintely being used to optimize plant maintenance and throughput, which is a smart way to squeeze more out of existing assets. Tech adoption is the only way to offset the 7-9% OpEx inflation.
Legal Factors: Compliance Costs and Regulatory Scrutiny
The legal landscape is tightening, primarily around labor and environment. The new Australian 'Same Job, Same Pay' laws could increase contractor costs significantly, directly impacting the bottom line in the Pilbara. This is a clear example of political policy becoming an immediate legal cost.
We're also seeing stricter global anti-corruption and transparency regulations, which complicate international supply chains and add compliance costs. Post-Brumadinho, regulatory scrutiny on tailings storage facility (TSF) management standards is higher than ever. What this estimate hides is the opportunity cost of longer approval times for water usage permits and environmental impact assessments. Proactively audit contractor payment structures and TSF compliance now.
Environmental Factors: Water Scarcity and Decarbonization CapEx
Environmental factors are now core operational risks, not just PR issues. BHP has a commitment to reduce operational (Scope 1 & 2) emissions by at least 30% by 2030, which is a massive capital undertaking. But the most immediate threat is water.
Severe water scarcity in Chile directly constrains Escondida's copper production capacity, which is a volume cap on their best commodity. Plus, climate change physical risks-like extreme weather-threaten port and rail infrastructure in the Pilbara, risking the entire 260 to 290 million tonnes iron ore flow. Biodiversity offset requirements are also increasing the cost and complexity of new project approvals. You can't build a mine without a clear, costly environmental plan anymore.
Next Step: Investment Committee: Re-run the Discounted Cash Flow (DCF) model by Monday, incorporating the 50% Chilean tax rate and the 7-9% OpEx inflation figure to stress-test the copper asset valuation.
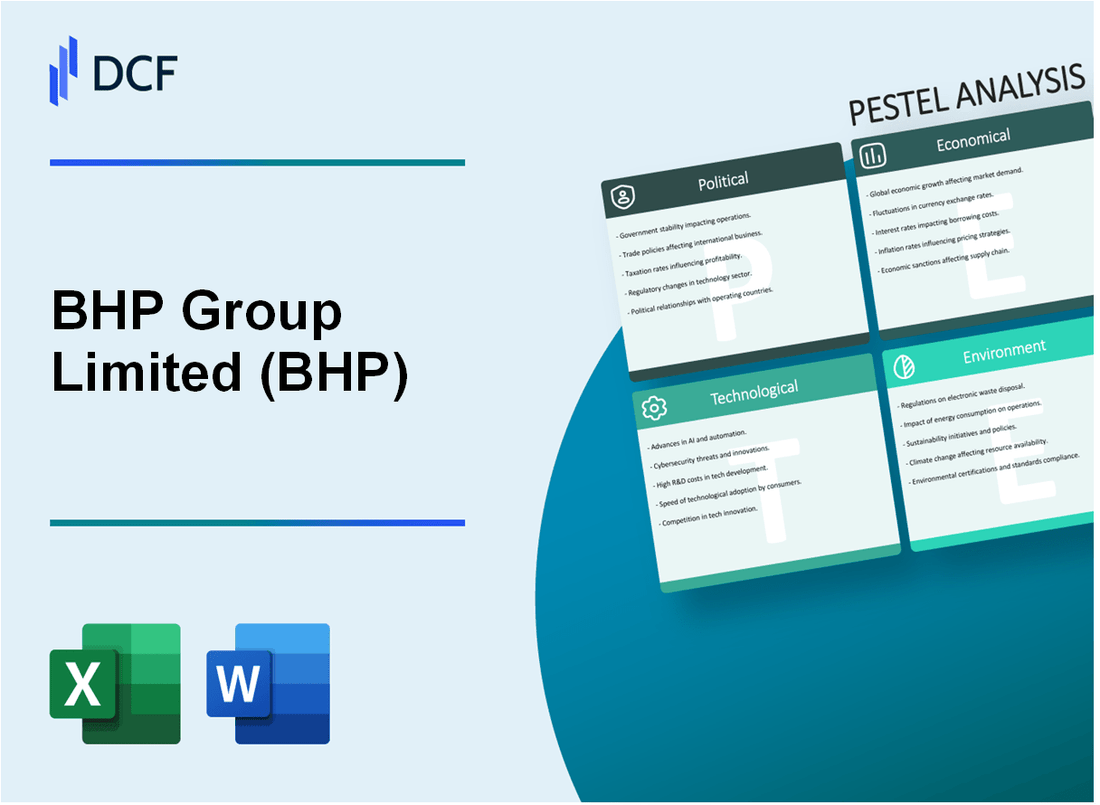
BHP Group Limited (BHP) - PESTLE Analysis: Political factors
Political risk is not a theoretical concept for a company the size of BHP Group Limited; it's a direct line item on the balance sheet. You need to understand that government policy changes in key jurisdictions like Australia and Chile are immediately translating into higher operating costs and a tighter regulatory environment in the 2025 fiscal year. This isn't just noise; it's a structural shift.
Chilean mining royalty law implementation increases tax burden to nearly 50%.
The implementation of Chile's new Mining Royalty Law (Law No. 21,591), effective January 1, 2024, is the most significant political headwind for BHP's copper division. This law replaces the old specific mining tax (IEAM) and introduces a two-tiered system: an ad-valorem component (a tax on sales) and a margin component (a tax on operational profit). This new structure dramatically increases the overall fiscal take.
The impact is clear: the effective tax burden on Chilean mining has risen to approximately 44.7% as of late 2025. To be fair, BHP's own global adjusted effective tax rate, once royalties are included, stood at 44.6% in FY2025. This puts Chile's tax regime well above competitors like Canada and Australia, which typically hover around the 40% mark. This is a massive competitive disadvantage for new investment.
Here's the quick math on the regional tax landscape as of late 2025:
| Country | Effective Tax Burden on Mining |
|---|---|
| Chile | 44.7% |
| Argentina | 43.8% |
| Peru | 42.5% |
| Canada / Australia | ~40% |
The new law also includes a maximum tax threshold to cap the combined corporate income tax and royalty, but the initial rise in the effective tax rate to nearly 50% for large, high-margin operations remains a key risk factor for BHP's Escondida and Spence copper mines.
Australian government's 'Closing Loopholes' industrial relations bill raises labor cost risks.
In Australia, the 'Fair Work Legislation Amendment (Closing Loopholes) Bill' has created a significant labor cost risk, particularly through the 'Same Job, Same Pay' (SJSP) provisions. This legislation allows the Fair Work Commission to order that labor hire workers be paid the same rate as a host company's direct employees doing the same work. It's a direct attack on the cost-saving flexibility the mining industry has relied on.
BHP has already felt the pressure. The company estimated the financial impact of the SJSP provisions on its Australian operations could be up to A$1.3 billion annually. That's a huge number. In one specific case, a wage alignment ruling following the new legislation resulted in an average wage increase of approximately $30,000 for more than 2,200 affected workers. This is a clear, defintely quantifiable increase in the cost base for Australian iron ore and coal operations.
The immediate actions for BHP are simple:
- Review all labor hire contracts for SJSP exposure.
- Quantify the full A$1.3 billion risk across all Australian assets.
- Shift labor strategy toward direct employment to mitigate regulatory complexity.
Geopolitical tensions, especially US-China trade dynamics, directly impact iron ore demand.
BHP is the world's third-largest iron ore producer, so US-China trade dynamics are not just a headline; they are a direct factor in the price of their core commodity. Renewed trade friction in 2025, including threats of additional 100% tariffs by the US, has soured market sentiment and curbed Chinese steel exports. This, in turn, reduces the demand for seaborne iron ore.
Analysts reacted quickly. The iron ore price forecast for 2025 was downgraded to average about $98.2/dmt (dry metric ton), a figure that reflects this geopolitical uncertainty. In October 2025, the benchmark November iron ore on the Singapore Exchange was trading around $104.25 per ton, a price highly vulnerable to any further escalation. China's economic growth target of around 5% is at risk from the trade spat, and if that growth slows, the steel industry will require less of BHP's product. It's a simple, direct correlation.
Increased resource nationalism in key operating regions like Chile and Peru.
Beyond the Chilean royalty law, a broader trend of resource nationalism is gaining steam across Latin America, particularly in copper-rich regions. This is essentially a push by governments to exert greater state control and capture a larger share of mining profits, often citing social spending and environmental concerns.
In Chile, the government's National Lithium Strategy, which seeks a majority state stake in all future lithium projects, signals a clear statist tilt. While BHP's main Chilean assets are copper, this policy sets a worrying precedent for all mineral rights. In neighboring Peru, which is the world's second-largest copper producer, the political environment remains volatile. While former President Castillo's pledges to nationalize were not fully realized, the underlying political pressure for increased taxes and community benefits remains high. This regional political environment increases the risk premium on all new capital expenditure in the Andean copper belt.
BHP Group Limited (BHP) - PESTLE Analysis: Economic factors
You're looking at BHP Group Limited's (BHP) economic landscape, and the story is one of a strategic shift: copper is your growth engine, but iron ore still dictates near-term profitability. The core takeaway is that while the long-term electrification trend provides a massive tailwind for copper, inflation is a clear and present danger that is eroding margins across the entire portfolio, forcing a relentless focus on unit cost control.
Copper prices remain strong, trading near $4.50 per pound due to energy transition demand
The global shift toward electrification and renewable energy is not just a buzzword; it's a fundamental economic driver for BHP. The demand for copper, a key metal in electric vehicles (EVs) and grid infrastructure, is keeping prices elevated. For the fiscal year 2025 (FY25), BHP realized an average copper price of US$4.25 per pound. This is a strong, resilient price point.
But the market strength didn't stop there. In the first quarter of fiscal year 2026 (Q1 FY26), BHP's average realized copper price climbed further to US$4.59 per pound, reflecting buoyant market conditions and tightening supply. Chile's state copper commission, Cochilco, supports this outlook, forecasting an average copper price of $4.45 per pound for the full 2025 calendar year. That's a powerful signal.
Here's the quick math on copper's growing importance:
- FY25 Copper Production: A record 2 million tonnes (Mt).
- FY25 Copper EBITDA: A record US$12.3 billion.
- Copper's Share of Total Underlying EBITDA: 45% in FY25, up from 29% a year prior.
Global inflation drives up operating costs (OpEx) for energy and consumables by 7-9%
Honesty, this is the biggest near-term risk. While commodity prices are high, global inflation is a massive headwind that is quietly eating away at margins. We are seeing persistent, high-single-digit cost inflation in key operational inputs. Though the broader mining industry saw input cost inflation moderate to an average of 3.6% in Q1 2025, the pressure on specific components like energy, labor, and consumables is much higher.
For BHP, the cumulative effect of inflation on labor, energy, and consumables is driving up unit costs, particularly at the high-cost end of the portfolio. This is why cost control is defintely the most critical action. For example, the company's half-year FY25 results reported a US$335 million negative impact from 'Inflation on costs' alone. This relentless pressure is what makes cost leadership-like the C1 reported unit cost of US$17.29 per tonne at Western Australia Iron Ore (WAIO) in FY25-a non-negotiable strategic advantage.
Iron ore price volatility creates uncertainty, with a 2025 forecast range of $100-$120/tonne
Iron ore remains the largest revenue generator, but its market is characterized by structural uncertainty, primarily due to China's property sector challenges and its push for carbon reduction. Prices are volatile, but they are generally holding a floor. Market research firm BMI has maintained its 2025 average iron-ore price forecast at $100 per tonne. This aligns with the volatility seen in the first half of the calendar year 2024, where prices traded within the $100 to $120 per tonne range.
The price floor is critical. BHP's own analysis estimates the real-time cost support (the price below which high-cost producers struggle) remains at $80-100 per tonne (CFR basis). This means any dip below that level forces marginal supply out of the market, which helps stabilize prices. The volatility is a fact of life; the cost support is the safety net.
| Economic Metric (FY25 Data) | Value / Range | Commentary |
|---|---|---|
| Copper Realized Price (FY25 Avg.) | US$4.25 per pound | Reflects strong demand from the global energy transition. |
| Iron Ore Realized Price (FY25 Avg.) | US$82.13 per wet metric tonne | A 19% decline from FY24, highlighting price volatility. |
| Iron Ore Price Support (CFR) | $80-100 per tonne | The estimated floor price for marginal seaborne supply. |
| Underlying Attributable Profit (FY25) | $10.16 billion | The lowest profit in five years, driven by lower iron ore prices. |
BHP's 2025 iron ore production guidance is a massive 260 to 290 million tonnes
Despite the price volatility, BHP's operational performance is exceptional. For the fiscal year 2025, BHP delivered record iron ore production from its WAIO operations (100% basis) of 290.0 million metric tonnes (Mt), hitting the upper end of its guidance. This massive volume is the company's counter-balance to price uncertainty.
Looking ahead, the guidance for the 2025-2026 financial year (FY26) is between 284 and 296 Mt (100% basis), demonstrating a commitment to sustained, high-volume output. This scale allows BHP to maintain its position as the lowest-cost major iron ore producer, which is the only way to win in a volatile market.
What this estimate hides is the sheer scale advantage. BHP is one of the few miners that can absorb a price drop because its unit costs are so low. That's why operational excellence is the company's best defense against macroeconomic headwinds.
BHP Group Limited (BHP) - PESTLE Analysis: Social factors
Labor shortages persist in Western Australia's Pilbara region, driving up wage demands.
The chronic labor shortage in Western Australia (WA), particularly for skilled trades and technical roles in the Pilbara, continues to be a major cost pressure for BHP's iron ore operations. The WA mining sector recorded a high of 135,693 on-site full-time equivalent (FTE) positions in 2024, with iron ore accounting for 65,359 of those roles-an increase of 4,500 FTE. This tight labor market, combined with cost inflation in energy and consumables, was a secondary factor contributing to BHP's underlying attributable profit falling to $10.16 billion in FY2025, a 25.6% decrease from the previous year.
The political landscape is also driving up labor costs. New 'same job, same pay' legislation is specifically targeting major miners like BHP, which will likely push up the cost of labor hired through contractors. This is a direct challenge to the company's cost-leadership position at its Western Australia Iron Ore (WAIO) assets. BHP has responded by streamlining operations, including cutting around 100 middle management and support roles in its iron ore division, but the structural shortage remains. It's a simple supply-demand problem that won't go away soon.
Growing investor and public pressure for improved Indigenous community engagement.
Investor and public scrutiny over Indigenous engagement, especially following cultural heritage incidents across the mining sector, has made this a critical social license to operate issue. BHP has significantly ramped up its economic and social contributions to Indigenous communities in response.
The company's total Indigenous procurement spend reached a record high of US$853 million in FY2025, marking an increase of 40% over FY2024. This is a defintely concrete action that directly builds economic capacity. Furthermore, the total Indigenous community investment, including complementary social value initiatives, exceeded US$54 million in FY2025. This investment is focused on key development areas:
- Community, health, and wellbeing: $9.4 million
- Indigenous governance, economic development, and advocacy: $8.4 million
- Education and training: $5 million
Indigenous employee participation at Minerals Australia operations stood at 9.0 per cent at 30 June 2025, showing slow but steady progress toward broader inclusion goals.
Heightened focus on workplace safety culture following the Samarco dam collapse legacy.
The 2015 Samarco dam failure remains a massive social and legal liability that fundamentally shapes BHP's safety culture and risk management today. The disaster, which claimed 19 lives and released 40-55 million cubic meters of tailings, saw a landmark UK court ruling in November 2025 find BHP liable, establishing a critical precedent for parent company accountability in joint ventures.
The financial impact is substantial and ongoing. BHP's provision for its obligations under the Brazil agreement was US$5.8 billion at 30 June 2025, which was updated to an estimated aggregate provision of US$5.5 billion at 31 October 2025 following the UK ruling. Expected cash outflows for the Samarco settlement are projected at US$2.2 billion for FY2026 and US$0.5 billion for FY2027.
On the operational front, the intense focus on safety is yielding results, with the company achieving an 18% reduction in high potential injury frequency on FY2024. That's a strong metric, but the legal and financial overhang of Samarco will persist for years.
Shifting public perception against thermal coal, pressuring divestment timelines.
Public and investor sentiment against thermal coal is a clear headwind, forcing a strategic shift away from the commodity. Thermal coal represents only about 3 per cent of BHP's asset base, making an exit a relatively minor portfolio adjustment but a major social signal.
The company's plan to close its Mount Arthur thermal coal mine by 2030 was seen as a positive step. However, a November 2025 deal to transfer over half of the Mount Arthur land to Malabar Resources for continued underground mining has drawn sharp criticism from groups like the Australasian Centre for Corporate Responsibility (ACCR), who called it a 'hollow signalling' backflip. This has complicated the narrative of a clean exit and highlights the tension between maximizing shareholder value and meeting public expectations on climate action.
The divestment of the Blackwater and Daunia mines, completed in April 2025, has already impacted production targets, leading to a lower coking coal target for the 2024-2025 financial year. The market wants to see a clean break, but BHP is prioritizing value extraction from the remaining resources.
| Social Factor Metric | FY2025 Data / Status | Context |
| Indigenous Procurement Spend (Record) | US$853 million | Up 40% on FY2024, addressing economic empowerment pressure. |
| Indigenous Employee Participation (Minerals Australia) | 9.0 per cent | Participation rate at 30 June 2025. |
| High Potential Injury Frequency Reduction | 18% on FY2024 | Key safety performance metric improvement. |
| Samarco Aggregate Provision (31 Oct 2025) | US$5.5 billion | Updated liability estimate following November 2025 UK court ruling. |
| Samarco Expected Cash Outflow (FY2026) | US$2.2 billion | Near-term financial commitment to remediation and compensation. |
| Thermal Coal Asset Exposure | 3 per cent of asset base | Low financial exposure, but high social and environmental risk profile. |
BHP Group Limited (BHP) - PESTLE Analysis: Technological factors
Expansion of autonomous haulage fleets and drilling across Pilbara operations.
BHP is defintely pushing the boundary on automation, treating it as a core productivity lever, not just a safety measure. You see this most clearly in the Pilbara, where the goal is near-total autonomy for materials movement. The entire fleet of production drills across all four major hubs is already fully autonomous, utilizing 26 rigs to ensure consistent, high-precision blast-hole drilling.
The haulage transition is also moving fast. For the Western Australia Iron Ore (WAIO) operations, the plan is to have ore haulage approximately 85% autonomous within the next couple of years. This shift is already complete at key sites like South Flank, where the entire fleet of 41 Komatsu 930e haul trucks was converted to autonomous operation. This isn't just about removing drivers; it's about running a 24/7 operation with higher utilization and a 6% increase in annualised truck hours over the past three years.
This level of automation creates a more stable, predictable cost structure.
Increased use of Artificial Intelligence (AI) for deep-cover exploration and resource modeling.
AI and machine learning are moving from niche projects to a central strategic mandate at BHP, particularly in the high-risk, high-reward area of exploration. In May 2025, the company launched an ambitious AI innovation strategy, creating new senior roles like 'Practice Lead for AI Mastery' to embed these capabilities across the entire value chain.
The core application is using AI to analyze vast geological, geophysical, and geochemical datasets to pinpoint deep-cover mineral deposits-the ones traditional methods miss. This is critical because the easy-to-find, near-surface deposits are largely exhausted.
A concrete example of this is the Xplor 2025 critical minerals accelerator program. This program seeks out and partners with exploration companies that are pioneering new concepts, data, and testing techniques, often leveraging AI to find the next generation of copper and nickel deposits needed for the global energy transition. This focus is a direct response to the expected 70% growth in global copper demand by 2050.
Significant capital expenditure on decarbonization technologies for Scope 1 and 2 emissions.
Decarbonization is a major capital theme, but the near-term spend is being carefully managed based on technology readiness. For the FY2025 fiscal year, the incremental capital expenditure, operating expenditure, and lease payments specifically for operational GHG emission reduction initiatives totaled approximately US$50 million.
The total planned spend for operational decarbonization over the entire decade to FY2030 has been revised to US$0.5 billion. This lower figure reflects a realistic assessment that the commercial viability of key diesel displacement technologies, especially for large haul trucks, is taking longer than expected, pushing the bulk of the spending-anticipated to be at least US$4 billion-into the 2030s.
Still, BHP is making targeted investments now to meet its medium-term target: a reduction in operational Scope 1 and 2 GHG emissions of at least 30 per cent by FY2030 from an FY2020 baseline.
Key decarbonization technology investments in FY2025 include:
- Signing contracts with COSCO Shipping for two ammonia dual-fuelled Newcastlemax bulk carriers.
- These carriers are expected to reduce GHG emissions by at least 50% and up to 95% per voyage when running on low- or zero-emissions ammonia.
- Partnering on commercial-scale Direct Reduced Iron (DRI) trials using Pilbara iron ores to develop a lower-carbon steelmaking pathway.
Digital twin technology is defintely being used to optimize plant maintenance and throughput.
Digital twin technology, which creates a virtual replica of a physical asset or entire value chain, is a crucial tool for optimizing complex operations. BHP uses these digital twins for predictive maintenance (PdM) on critical, high-value assets like crushers, conveyors, and processing plants.
The integration of Generative AI (GenAI) with these digital twin models is a key focus in 2025. This allows non-technical users to query the model using natural language, simulating complex scenarios and predicting outcomes faster than traditional modeling. For example, the digital twin deployed at the BMA operations has been instrumental in uplifting decision-making confidence for long-term mine planning.
Here's the quick math on the value proposition: Predicting a failure on a primary crusher even one week earlier can save millions in lost production and repair costs.
| Technology Focus Area | FY2025 Status / Metric | Strategic Impact |
|---|---|---|
| Autonomous Haulage (WAIO) | Targeting 85% autonomous haulage by FY2026. All production drills (26 rigs) are fully autonomous. | Increases equipment utilization (up 6% in truck hours) and improves safety and cost consistency. |
| Decarbonization CapEx (Scopes 1 & 2) | Incremental spend was approximately US$50 million in FY2025. Total revised spend to FY2030 is US$0.5 billion. | Maintains trajectory toward 30% emissions reduction by FY2030 target, while deferring major diesel displacement spend until technology matures. |
| Digital Twin & GenAI | Integrated with value chain models (mine to port); deployed at BMA operations to enhance mine planning. | Enables advanced predictive maintenance for crushers and conveyors, and improves strategic decision-making confidence. |
| AI in Exploration | Launched major AI innovation strategy in 2025; running Xplor 2025 program to accelerate critical mineral discovery. | Addresses the challenge of finding deep-cover deposits to meet projected 70% copper demand growth by 2050. |
BHP Group Limited (BHP) - PESTLE Analysis: Legal factors
New Australian 'Same Job, Same Pay' laws could increase contractor costs significantly.
The Australian Federal Government's 'Same Job, Same Pay' legislation, which came into effect in 2024, is now a major legal and financial factor for BHP. The intent is clear: labour hire workers must receive the same pay and conditions as directly employed staff doing the same work. A landmark Fair Work Commission (FWC) ruling in July 2025, upheld by the Federal Court in September 2025, has confirmed the application of these laws to BHP's operations.
This decision directly affects over 2,200 labour hire workers at three of the company's Central Queensland coal mines-Saraji, Peak Downs, and Goonyella Riverside. The average annual wage adjustment for these workers is approximately $30,000, which translates to an immediate annual cost increase of around $66 million for this group alone.
The bigger risk is the flow-on effect. The Australian Resources and Energy Employer Association (AREEA) estimates the potential total annual cost to BHP, if similar rulings are applied across all its Australian operations utilizing labour hire, could reach up to $1.3 billion. This is a defintely material increase to the cost base and forces a strategic re-evaluation of the company's labour model.
| Legal/Regulatory Impact | FY2025 Financial/Operational Data | Strategic Implication |
|---|---|---|
| Same Job, Same Pay Legislation (Australia) | Immediate annual wage increase of ~$66 million for 2,200 workers. | Increased operational costs; incentive to insource labour or accelerate automation to offset rising wages. |
| Potential Flow-on Cost (AREEA Estimate) | Up to $1.3 billion in potential annual cost increases. | Significant long-term risk to Australian asset profitability and capital allocation decisions. |
Stricter global anti-corruption and transparency regulations impact international supply chains.
Global anti-corruption and transparency regulations, such as the U.S. Foreign Corrupt Practices Act (FCPA) and the UK Bribery Act, continue to drive up compliance costs and complexity across BHP's international supply chain, especially in high-risk jurisdictions in Africa and Asia. The company's own internal controls remain under intense scrutiny, a consequence of past issues like the 2015 settlement with the U.S. Securities and Exchange Commission (SEC) for 2008 Beijing Olympics hospitality violations, which resulted in a $25 million fine.
In the 2025 fiscal year, BHP's internal Compliance team provided input into 21 anti-corruption risk assessments, demonstrating the continuous, high-volume effort required to manage this legal exposure. Any misstep in the supply chain, from a minor customs payment to a major contract negotiation, can result in massive fines and reputational damage.
Key areas of compliance focus in 2025 include:
- Enhanced due diligence on third-party vendors and agents.
- Stricter controls on political donations and government interactions.
- Mandatory, risk-based anti-corruption training for all employees and contractors.
Compliance is not optional; it's a non-negotiable cost of doing business globally.
Increased regulatory scrutiny on tailings storage facility (TSF) management standards post-Brumadinho.
Following the tragic dam failures at Samarco (a non-operated joint venture) and Brumadinho, the Global Industry Standard on Tailings Management (GISTM) has become the de facto mandatory legal standard. The deadline for all TSFs not classified as 'Extreme' or 'Very High' consequence to be in conformance with GISTM was August 2025.
BHP has made solid progress, but full compliance remains an ongoing legal and engineering challenge. As of August 2025, the company reported that 61 of its TSFs are aligned with GISTM, while 9 facilities are still working towards full alignment. Crucially, 92% of the company's 'Very High' and 'Extreme' consequence TSFs have received third-party validation, showing risk-based prioritization.
The legal liability for past events was reaffirmed in November 2025, when the High Court in London found BHP strictly liable for the pollution caused by the 2015 Samarco dam collapse. This landmark ruling underscores the company's enduring legal exposure and the need for significant financial provisions for remediation and compensation, regardless of joint venture status.
Water usage permits and environmental impact assessments face longer approval times.
The legal and regulatory environment for new project approvals, particularly those involving water use, is lengthening timelines and increasing capital risk. This is a critical factor in the delay of major growth projects.
The most visible example is the deferral of the large-scale Olympic Dam expansion in South Australia, which was confirmed in August 2025. The project, underpinned by the $9.6 billion acquisition of OZ Minerals, has been pushed back to the next decade. While multiple factors are involved, the complexity of environmental and energy approvals is a key regulatory headwind.
In Chile, water permits remain an acute legal risk. At the Cerro Colorado copper mine, a 2022 court ruling restricted water extraction from the Lagunillas aquifer to as low as 54 liters/second (l/s), down from a previously authorized 108 l/s, with a near-total prohibition on extraction starting in 2024. This kind of legal intervention directly curtails operational capacity.
This regulatory friction in Australia is also driving investment elsewhere. Competitor jurisdictions like Argentina are actively reforming their regulatory frameworks, including streamlining export processes, which makes them a more attractive destination for capital expenditure in copper and lithium projects in the 2025-2027 window.
BHP Group Limited (BHP) - PESTLE Analysis: Environmental factors
Commitment to reduce operational (Scope 1 & 2) emissions by at least 30% by 2030
You need to know that BHP Group Limited is defintely on track to meet its ambitious medium-term target for operational emissions. The company is aiming for a reduction of at least 30% in its Scope 1 (direct) and Scope 2 (indirect from purchased energy) greenhouse gas (GHG) emissions by the end of Fiscal Year 2030 (FY2030), benchmarked against the FY2020 baseline.
The progress is significant: by FY2023, BHP had already achieved a 32% reduction in these operational emissions. This was largely driven by switching to renewable power sources at major operations like the Escondida and Spence mines in Chile. To maintain this trajectory, and to counter emissions growth from new projects, the company is committing substantial capital, planning an investment of approximately US$4 billion in decarbonisation initiatives through FY2030.
The immediate near-term goal is a 50% reduction in Scope 2 emissions by the end of FY2025, achieved through long-term Renewable Power Purchase Agreements (PPAs). Diesel remains the largest challenge, accounting for 62% of operational emissions, so the focus is shifting to electrification projects and the deployment of technologies like trolley assist electric haul trucks in Chile.
| Emissions Target and Progress (FY2025 Context) | Target | FY2023 Progress (vs. FY2020 Baseline) | Investment to FY2030 |
|---|---|---|---|
| Operational GHG Reduction (Scope 1 & 2) | At least 30% by FY2030 | 32% reduction achieved | Approx. US$4 billion |
| Scope 2 Emissions Reduction (Near-Term) | 50% by FY2025 (via PPAs) | On track | Included in total decarbonisation spend |
Severe water scarcity in Chile directly constrains Escondida's copper production capacity
Water scarcity in the arid Atacama Desert is a fundamental, structural constraint on copper production in Chile, but BHP has largely mitigated the direct production impact at Escondida through massive capital investment. The company has ceased all groundwater extraction from the high Andean aquifers for operational purposes, a crucial step for environmental and social license.
This shift required an investment of US$4 billion over the past 15 years in desalination plants to supply desalinated seawater. The switch to desalinated water initially increased electricity consumption and Scope 2 emissions, but BHP is offsetting this by transitioning Escondida to 100% renewable power sources from 2022. Despite the underlying water-energy nexus complexity and lower ore grades, Escondida's operational performance was strong in FY2025, reporting a production of 114,800 metric tons in July 2025, representing a 7.8% year-over-year increase.
Climate change physical risks, like extreme weather, threaten port and rail infrastructure
Acute physical climate risks-like intense rainfall, floods, cyclones, and extreme heat-pose a clear and present threat to BHP's geographically dispersed assets, especially its critical port and rail infrastructure. The long life of mining assets means they will face increasingly volatile conditions.
In FY2025, the company used its internal Climate Hazard Dataset (CHD) to analyze potential safety, production, and cost impacts across its operated assets, including flood modeling. You can see this risk in action in the company's FY2025 operational results: while overall Queensland steelmaking coal volumes rose 5%, the increase was achieved despite having to offset the impact of 'heavy wet weather and geotechnical challenges.' This confirms that extreme weather is a tangible factor that directly impacts operational efficiency and necessitates higher-cost mitigation efforts.
Biodiversity offset requirements are increasing the cost and complexity of new project approvals
The regulatory and social expectation for environmental stewardship is driving up the complexity and cost of securing approvals for new projects. BHP is committed to achieving a 'no-net-loss' of biodiversity overall, which necessitates identifying and implementing compensatory actions or biodiversity offsets.
This commitment translates into a requirement to integrate 'natural capital' valuation into investment decisions and risk management frameworks. For example, the new Jansen potash project is currently in the development phase, and while its operating requirements for biodiversity do not yet apply for FY2025, the project's future approval and operational costs will be heavily influenced by these offset requirements. The company is focused on a foundational framework to select locally relevant metrics to track the effectiveness of land and water management actions, including:
- Valuing natural capital in investment and operational decisions.
- Identifying and implementing compensatory biodiversity offsets.
- Tracking over 98,000 hectares of area under nature-positive management practices as of August 2025.
This focus means project timelines can stretch, and capital expenditure needs to include significant outlays for conservation, restoration, and regenerative practices to gain social and regulatory acceptance.
Disclaimer
All information, articles, and product details provided on this website are for general informational and educational purposes only. We do not claim any ownership over, nor do we intend to infringe upon, any trademarks, copyrights, logos, brand names, or other intellectual property mentioned or depicted on this site. Such intellectual property remains the property of its respective owners, and any references here are made solely for identification or informational purposes, without implying any affiliation, endorsement, or partnership.
We make no representations or warranties, express or implied, regarding the accuracy, completeness, or suitability of any content or products presented. Nothing on this website should be construed as legal, tax, investment, financial, medical, or other professional advice. In addition, no part of this site—including articles or product references—constitutes a solicitation, recommendation, endorsement, advertisement, or offer to buy or sell any securities, franchises, or other financial instruments, particularly in jurisdictions where such activity would be unlawful.
All content is of a general nature and may not address the specific circumstances of any individual or entity. It is not a substitute for professional advice or services. Any actions you take based on the information provided here are strictly at your own risk. You accept full responsibility for any decisions or outcomes arising from your use of this website and agree to release us from any liability in connection with your use of, or reliance upon, the content or products found herein.