
|
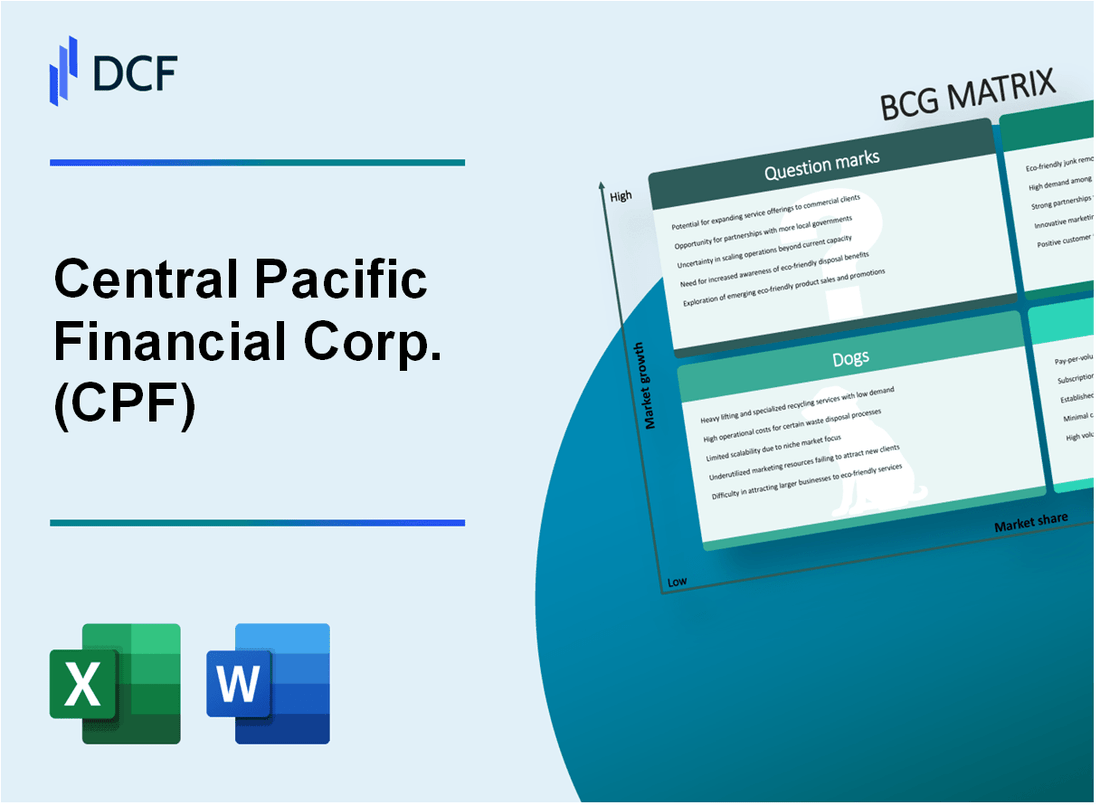
Central Pacific Financial Corp. (CPF): BCG Matrix [Apr-2026 Updated] |
Fully Editable: Tailor To Your Needs In Excel Or Sheets
Professional Design: Trusted, Industry-Standard Templates
Investor-Approved Valuation Models
MAC/PC Compatible, Fully Unlocked
No Expertise Is Needed; Easy To Follow
Central Pacific Financial Corp. (CPF) Bundle
Central Pacific Financial Corp.'s business lines are at an interesting inflection point as we look toward the end of 2025, and you need a clear map of where to place your focus. I've distilled their portfolio using the four quadrants of the BCG Matrix, showing you exactly where the growth is-like in Hawaii Commercial and Construction Loans-and what's funding it all: the bedrock Cash Cow core deposits, sitting at approximately $6.58 billion as of September 30, 2025. But honestly, the story isn't just about the winners; you need to see the pressure points in the Residential Mortgage runoff and the strategic bets in the Wealth Management Group to truly understand the path forward for Central Pacific Financial Corp.
Background of Central Pacific Financial Corp. (CPF)
You're looking at Central Pacific Financial Corp. (CPF), which you should know is the holding company for Central Pacific Bank (CPB). As of late 2025, this is a Hawaii-based operation, trading on the New York Stock Exchange under the symbol 'CPF.'
The bank itself has a deep local history, having been founded back in 1954 by a group of World War II veterans. Their initial goal was to help immigrant families establish themselves away from the plantation life. Today, Central Pacific Bank serves the financial needs of all families and small businesses across the Islands.
By the end of the third quarter of 2025, Central Pacific Financial Corp. reported total assets of approximately $7.42 billion. Its primary subsidiary, Central Pacific Bank, maintains a physical presence with 27 branches and 55 ATMs operating throughout the state of Hawaii.
The company positions itself as a significant supporter of the local economy, specifically as a market leader in originating both residential mortgages and SBA loans for small businesses in Hawaii. This focus on local needs is something management emphasizes, and it seems to be working; CPB was named the Best Bank in Hawaii by Forbes Magazine in 2025, which was the fourth year in a row they made that list.
To give you a snapshot of its recent performance leading into the end of 2025, for the third quarter, Central Pacific Financial Corp. posted a net income of $18.6 million, translating to $0.69 per diluted share. The net interest margin expanded to 3.49% during that period, reflecting what management called disciplined balance sheet management. At that same point, total loans stood at $5.37 billion.
Finance: draft the relative market share assumptions for the loan portfolio segments by next Tuesday.
Central Pacific Financial Corp. (CPF) - BCG Matrix: Stars
You're analyzing the portfolio for Central Pacific Financial Corp. (CPF) and the Stars quadrant represents the business units with the highest current momentum in growing markets. These are the areas where market share leadership is being established or maintained while the underlying market is expanding, demanding significant cash investment to fuel that growth.
The overall loan portfolio demonstrated this high-growth characteristic in the third quarter of 2025, with total loans increasing by a net of $77 million. Within the core Hawaii market, this net growth was driven by specific segments, though it was partially offset by runoff in other areas. Specifically, the Hawaii Commercial and Construction Loans segment was a contributor to this positive net growth, signaling strong demand in the local business and building sectors, which aligns with the Star profile of high market share in a growing market.
Here is a look at the key financial indicators supporting the Star categorization for these growth-oriented segments:
| Metric | Value/Range | Period/Context |
| Net Interest Income (NII) | $61.3 million | Q3 2025 Result |
| Net Interest Income (NII) Guidance | $62 million to $63 million | Q4 2025 Guidance |
| Mainland Loan Portfolio Percentage | 15% to 20% | Of Total Loans |
| Hawaii Loan Portfolio Net Growth | $77 million | Q3 2025 |
The commitment to small business lending is a clear market leadership play, positioning Small Business Administration (SBA) loan originations as a Star. While the most recent volume data is from 2024, it establishes the required market dominance. In 2024, Central Pacific Bank was recognized as the top SBA lender in Hawaii, surpassing all other Hawaii Banks combined in both the number and dollar amount of SBA loans awarded. This included approving 113 7(a) loans, totaling more than $9.5 million, and leading Hawaii and Guam in SBA 504 loan approvals with three transactions.
To ensure diversification and capture growth outside the core island economy, Central Pacific Financial Corp. maintains a strategic focus on the Mainland Commercial Real Estate (CRE) and Construction loans segment. This area is deliberately managed to represent between 15% to 20% of the total loan portfolio. The Mainland Loan Portfolio specifically showed growth in commercial mortgage and construction sectors during the third quarter of 2025, indicating this segment is actively consuming cash to maintain its strategic size and market presence.
The high-growth nature of these areas is reflected in the forward-looking guidance for core profitability. Net Interest Income (NII) for the third quarter of 2025 was $61.3 million, which represented a 2.5% sequential increase. Management is guiding for continued momentum, projecting NII for the fourth quarter of 2025 to be between $62 million and $63 million, alongside an expected Net Interest Margin expansion of 5 to 10 basis points. This investment in growth, supported by strong NII expectations, is the hallmark of a Star requiring continued capital support.
- Maintain focus on high-quality, relationship-driven lending.
- Support the Mainland CRE/Construction segment within the 15% to 20% target.
- Continue investment to sustain SBA market leadership position.
- Monitor Q4 NII guidance achievement of $62 million to $63 million.
Finance: draft 13-week cash view by Friday.
Central Pacific Financial Corp. (CPF) - BCG Matrix: Cash Cows
You're looking at the core engine of Central Pacific Financial Corp. (CPF), the business units that dominate their mature market and print cash to fund everything else. These are the units where competitive advantage is established, meaning they generate high profit margins without needing heavy promotional spending.
The stability of this segment is anchored by the Core Hawaii Deposit Base. As of September 30, 2025, total deposits stood at $6.58 billion. More specifically, the relationship-based retail and small business deposits, which form the stable, low-cost funding, or Core Deposits, totaled $5.98 billion at that same date. This funding base supports margin optimization; for instance, the Net Interest Margin for the third quarter of 2025 was reported at 3.49%.
This market leadership isn't just about deposits; it's about reputation. The overall Central Pacific Bank franchise was recognized as Best Bank in Hawaii by Forbes for 2025. You are operating in a market where this recognition is significant, even if the growth rate of the overall Hawaiian banking market is low. Honestly, being named the best bank for the fourth defintely consecutive year in 2025 solidifies that high market share position you've built.
Cash Cows must maintain strong balance sheets, and CPF certainly does. The capital position reflects this strength, which allows for passive cash harvesting rather than constant recapitalization. As of March 31, 2025, the Common Equity Tier 1 (CET1) ratio was 12.4%, significantly exceeding regulatory minimums. This is a clear indicator of a mature, well-capitalized business unit.
To give you a clearer picture of the operational metrics supporting this Cash Cow status, look at these figures from the recent reporting periods. We focus on the latest available data points to confirm the 'milk the gains' strategy is sound:
| Metric | Value as of September 30, 2025 | Value as of March 31, 2025 |
| Total Assets | $7.42 billion | N/A |
| Total Deposits | $6.58 billion | $6.60 billion |
| Core Deposits | $5.98 billion | $5.98 billion |
| Total Loans | $5.37 billion | $5.33 billion |
| Common Equity Tier 1 (CET1) Ratio | 12.6% | 12.4% |
The strategy here is to invest just enough to maintain efficiency and support infrastructure, not to aggressively chase growth. The efficiency ratio for the third quarter of 2025 was 62.84%. While not best-in-class, it shows the operational costs are managed within a stable revenue stream generated by these core assets. You want to keep that ratio from creeping up, perhaps by investing in back-office efficiency improvements rather than broad market advertising.
The consistent dividend payout reflects the cash generation. The quarterly cash dividend declared in July 2025 was $0.27 per share, payable in September 2025. This steady return is what shareholders expect from a Cash Cow. Finance: draft the projected cash flow impact of a 50 basis point reduction in the average cost of core deposits by next Tuesday.
Central Pacific Financial Corp. (CPF) - BCG Matrix: Dogs
You're looking at the business units within Central Pacific Financial Corp. (CPF) that fit the profile of Dogs-those operating in markets with low growth or experiencing contraction, and where the company holds a relatively low market share, tying up capital without generating significant returns. These are the areas where expensive turn-around plans often fail to pay off.
The components identified as fitting this category are characterized by portfolio runoff or pressure from the prevailing interest rate environment, suggesting they are cash traps or candidates for divestiture, even if they currently break even.
The specific areas exhibiting these characteristics include:
- - Runoff in the Residential Mortgage portfolio, pressured by the current interest rate environment.
- - Home Equity Line of Credit (HELOC) portfolio, also experiencing runoff due to higher rates.
- - Noninterest-bearing Demand Deposit Accounts (DDA), which saw fluctuations and pressure from customers seeking higher-yield products.
- - Certain legacy investment securities that required a $9.9 million pre-tax loss repositioning in late 2024 to optimize the balance sheet.
The pressure on the loan segments is evident in the reported portfolio movements. For instance, in the third quarter of 2025, total loans saw approximately $230 million in portfolio runoff, which was specifically attributed to declines in the residential mortgage and home equity portfolios, even as other lending segments grew. This runoff suggests low or negative growth in these specific asset classes, which is a hallmark of a Dog.
Here are some of the relevant financial metrics associated with the balance sheet activities that inform this categorization, using the latest available data points:
| Metric/Period | Value/Amount | Context |
| Investment Securities Pre-Tax Loss (4Q24) | $9.9 million | Loss recognized on repositioning of legacy available-for-sale debt securities. |
| Loan Portfolio Runoff (3Q25) | $230 million | Reported runoff in the third quarter of 2025, primarily from residential mortgage and home equity. |
| Total Loans Decrease (2Q25 vs 1Q25) | $44.7 million | Sequential decrease in total loans as of June 30, 2025. |
| Total Loans Decrease (2Q25 vs 2Q24) | $93.8 million | Year-over-year decrease in total loans as of June 30, 2025. |
| Total Deposits (3Q25 Period-End) | $6.6 billion | Total deposits as of the end of the third quarter of 2025. |
| Average Rate Paid on Total Deposits (2Q25) | 1.02% | Average rate paid on total deposits for the second quarter of 2025. |
The repositioning of the legacy investment securities, while resulting in a $9.9 million pre-tax loss in the fourth quarter of 2024, was intended to be accretive, estimating a prospective annual increase to net interest income of $2.7 million beginning in 2025. This action itself signals the need to move capital out of low-yielding assets, which is a typical strategy for managing a Dog, even if the initial cost is high.
Regarding the deposit base, while average noninterest-bearing DDA deposits showed continued growth in the third quarter of 2025, the period-end balances experienced normal fluctuations, reflecting customer movement toward higher-yield products, which puts pressure on this funding source.
The overall loan portfolio performance in the third quarter of 2025 showed that growth was concentrated elsewhere:
- - Growth driven by commercial lending.
- - Growth driven by commercial mortgage lending.
- - Growth driven by construction lending.
This concentration of growth in other areas further highlights the stagnant or declining nature of the residential mortgage and home equity segments, reinforcing their Dog categorization.
Finance: draft 13-week cash view by Friday.
Central Pacific Financial Corp. (CPF) - BCG Matrix: Question Marks
You're looking at the areas within Central Pacific Financial Corp. (CPF) that are in high-growth markets but haven't yet secured a dominant market share-the classic Question Marks. These units are burning cash now because they require significant investment to scale up, but they hold the potential to become future Stars. Honestly, if they don't gain traction quickly, they risk sliding into the Dog quadrant.
The Wealth Management Group is a prime example of this dynamic. In the third quarter of 2025, this group was a key driver, contributing to total other operating income reaching $13.5 million, an increase of $0.5 million quarter-over-quarter. Management noted that Q3 is typically a strong quarter for this revenue stream, suggesting the growth needs to be sustained beyond seasonal peaks to truly establish market share in this competitive space. This unit needs capital infusion to move beyond its current contribution level.
The strategic international expansion, specifically the partnership with The Kyoto Shinkin Bank signed on October 6, 2025, fits the Question Mark profile perfectly. This move is designed to tap into the growing economic ties between Hawaii and Japan's Kyoto region, targeting small and midsize enterprises looking to expand overseas. While Central Pacific Financial Corp. held total assets of approximately $7.42 billion as of September 30, 2025, this new international bridge represents a high-potential, low-share market entry that will require sustained operational investment to yield significant returns.
Ongoing technology and digital investments are another area consuming cash for future growth. Management explicitly stated they are investing in technology and people to drive efficiencies, with a goal of improving the efficiency ratio toward the high-50s/mid-50s. This investment pressure is visible in the operating expenses, which rose to $47.0 million in Q3 2025, up $3.1 million from the prior quarter, partly due to a $1.5 million one-time cost from office consolidation. You have to spend it to save it, but for now, it's a cash drain.
Finally, the strategy around selective indirect and wholesale credit exposure requires careful monitoring, characteristic of a Question Mark. This approach is meant to diversify risk by accessing broader markets for a better return per unit of risk. As of Q3 2025, the Shared National Credit (SNC) portfolio stood at approximately $526 million. This segment, which is part of the Mainland Loan Portfolio that makes up 15% to 20% of total loans, needs to prove its superior risk-adjusted returns against the core local lending business.
Here's a quick look at where some of these growth/investment areas sit relative to the overall loan book as of late 2025:
| Credit Segment/Investment Area | Relevant Financial Metric (As of Q3 2025 or Sept 30, 2025) | Value/Range |
| Total Loans (Base for Market Share) | Total Loans (September 30, 2025) | $5.367 billion |
| Wholesale/Indirect Credit Exposure | Shared National Credit (SNC) Portfolio | $526 million |
| Mainland Loan Exposure | Percentage of Total Loans | 15% to 20% |
| Wealth Management Contribution | Total Other Operating Income (Q3 2025) | $13.5 million |
| Technology/Efficiency Investment Impact | Q3 2025 Operating Expenses | $47.0 million |
The key decision here is whether to double down on the technology spend and the Japan partnership or to cut losses if the growth trajectory doesn't materialize in the next few reporting periods. If the efficiency ratio doesn't move toward the mid-50s soon, that expense line becomes a Dog liability.
Disclaimer
All information, articles, and product details provided on this website are for general informational and educational purposes only. We do not claim any ownership over, nor do we intend to infringe upon, any trademarks, copyrights, logos, brand names, or other intellectual property mentioned or depicted on this site. Such intellectual property remains the property of its respective owners, and any references here are made solely for identification or informational purposes, without implying any affiliation, endorsement, or partnership.
We make no representations or warranties, express or implied, regarding the accuracy, completeness, or suitability of any content or products presented. Nothing on this website should be construed as legal, tax, investment, financial, medical, or other professional advice. In addition, no part of this site—including articles or product references—constitutes a solicitation, recommendation, endorsement, advertisement, or offer to buy or sell any securities, franchises, or other financial instruments, particularly in jurisdictions where such activity would be unlawful.
All content is of a general nature and may not address the specific circumstances of any individual or entity. It is not a substitute for professional advice or services. Any actions you take based on the information provided here are strictly at your own risk. You accept full responsibility for any decisions or outcomes arising from your use of this website and agree to release us from any liability in connection with your use of, or reliance upon, the content or products found herein.