
|
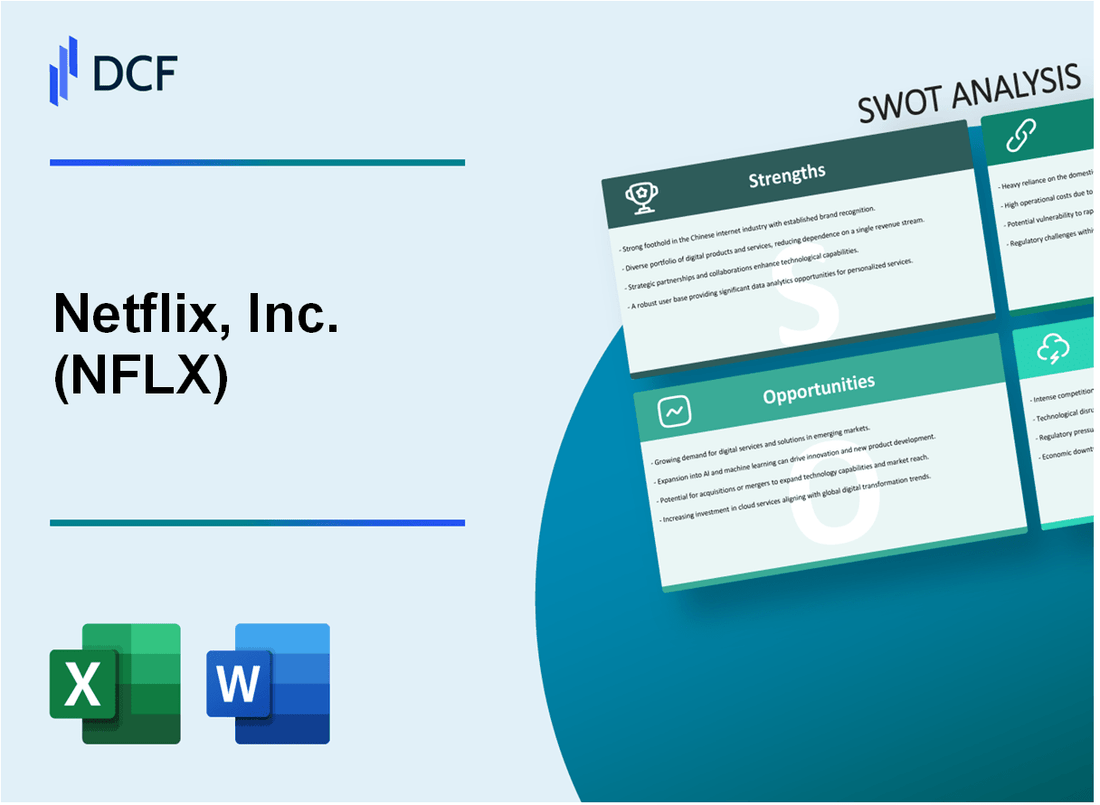
Netflix, Inc. (NFLX): SWOT Analysis [Jan-2025 Updated] |
Fully Editable: Tailor To Your Needs In Excel Or Sheets
Professional Design: Trusted, Industry-Standard Templates
Investor-Approved Valuation Models
MAC/PC Compatible, Fully Unlocked
No Expertise Is Needed; Easy To Follow
Netflix, Inc. (NFLX) Bundle
In the dynamic world of digital entertainment, Netflix has emerged as a transformative powerhouse, revolutionizing how global audiences consume media. With 260 million paid subscribers and an unparalleled content strategy, the streaming giant continues to navigate a complex landscape of technological innovation, market competition, and evolving consumer preferences. This comprehensive SWOT analysis unveils the intricate dynamics behind Netflix's current business model, exploring its remarkable strengths, potential vulnerabilities, emerging opportunities, and the critical challenges that could shape its future trajectory in the highly competitive streaming ecosystem.
Netflix, Inc. (NFLX) - SWOT Analysis: Strengths
Dominant Global Streaming Platform
As of Q4 2023, Netflix reported 260.8 million paid subscribers worldwide. The platform generated $8.83 billion in revenue during the fourth quarter of 2023.
| Subscriber Metric | Number |
|---|---|
| Total Paid Subscribers | 260.8 million |
| Quarterly Revenue | $8.83 billion |
| Content Spending (2023) | $17 billion |
Extensive Original Content Production
Netflix invested $17 billion in content production during 2023. The platform released over 1,500 original titles across various genres and languages.
- Over 70 Oscar nominations for original content
- More than 200 Emmy nominations in 2023
- Content available in 190 countries
Advanced Recommendation Algorithm
Netflix's recommendation system drives approximately 80% of content watched on the platform. The algorithm analyzes 3 billion recommendations per day.
Brand Recognition and Market Leadership
Netflix holds a market share of 55% in the global streaming market. The company's brand value was estimated at $34.4 billion in 2023.
Technological Innovation
Netflix employs over 10,000 technology and engineering professionals. The company files approximately 100 technology patents annually.
| Technology Metric | Value |
|---|---|
| Technology Employees | 10,000+ |
| Annual Technology Patents | ~100 |
| Content Delivery Networks | 225+ global locations |
Netflix, Inc. (NFLX) - SWOT Analysis: Weaknesses
High Content Production and Licensing Costs Impacting Profitability
Netflix spent $17.7 billion on content in 2023, representing a significant financial burden. The content production and licensing expenses continue to strain the company's profitability margins.
| Year | Content Spending | Operating Margin |
|---|---|---|
| 2022 | $16.5 billion | 20.3% |
| 2023 | $17.7 billion | 22.1% |
Increasing Competition from Streaming Services
Competitive landscape shows significant market pressure from multiple streaming platforms.
- Disney+ subscribers: 157.8 million (Q4 2023)
- Amazon Prime Video: Estimated 200 million subscribers
- HBO Max: 95.2 million subscribers
Substantial Debt from Content Investments
Netflix's long-term debt as of Q4 2023 stood at $16.2 billion, primarily driven by content expansion and global market penetration strategies.
Limited Geographical Penetration in Emerging Markets
Market penetration challenges in key regions:
| Region | Subscriber Penetration | Growth Potential |
|---|---|---|
| India | 5.5% | High |
| Africa | 3.2% | Very High |
| Southeast Asia | 7.8% | High |
Dependence on Subscriber Growth
Subscriber metrics for 2023:
- Total subscribers: 260.8 million
- Subscriber growth rate: 13.2%
- Average revenue per user: $15.49
The company's financial performance remains critically linked to continuous subscriber acquisition and retention strategies.
Netflix, Inc. (NFLX) - SWOT Analysis: Opportunities
Expansion into International Markets with Localized Content Strategies
Netflix reported 260.8 million paid subscribers globally as of Q4 2023, with significant international growth potential. International markets represent 61.4% of total subscriber base.
| Region | Subscriber Growth | Content Investment |
|---|---|---|
| Asia-Pacific | 23.6% YoY growth | $1.2 billion local content investment |
| Latin America | 18.4% YoY growth | $850 million local content investment |
| Europe, Middle East, Africa | 16.9% YoY growth | $1.5 billion local content investment |
Potential Growth in Gaming and Interactive Content Platforms
Netflix gaming portfolio expanded to 86 mobile games as of January 2024, with 40 million monthly active gaming users.
- Gaming revenue potential estimated at $2.1 billion by 2026
- Mobile game downloads increased 68% in 2023
- Interactive content engagement rates show 35% higher user retention
Development of Ad-Supported Subscription Tiers
Netflix's ad-supported tier launched in November 2022 with current subscriber base of 15 million users.
| Tier | Monthly Price | Projected Subscribers |
|---|---|---|
| Basic with Ads | $6.99 | 25 million by end of 2024 |
| Standard with Ads | $9.99 | 18 million by end of 2024 |
Strategic Partnerships with Telecommunications and Technology Companies
Current partnership portfolio includes collaborations with 47 telecommunications providers across 23 countries.
- T-Mobile partnership reached 3.2 million bundled subscribers
- Verizon collaboration generated $420 million in joint revenue
- Technology partnerships with Samsung, Apple, and Roku
Exploring Emerging Technologies like AI-Driven Content Creation
Netflix invested $500 million in AI and machine learning technologies in 2023.
| Technology | Investment | Projected Impact |
|---|---|---|
| AI Content Generation | $200 million | Potential 40% production cost reduction |
| Recommendation Algorithms | $180 million | Estimated 25% increased user engagement |
| Content Personalization | $120 million | Expected 30% improved viewer retention |
Netflix, Inc. (NFLX) - SWOT Analysis: Threats
Intense Competition in Streaming Market
As of 2024, Netflix faces significant competition from multiple streaming platforms:
| Competitor | Subscriber Count | Monthly Subscription Price |
|---|---|---|
| Disney+ | 157.8 million subscribers | $13.99 |
| Amazon Prime Video | 200 million subscribers | $8.99 |
| HBO Max | 95.6 million subscribers | $15.99 |
Rising Content Production Costs
Content production expenses continue to escalate:
- Netflix content budget for 2024: $17 billion
- Average per-series production cost: $70 million
- High-end series production costs: Up to $250 million per season
Potential Economic Downturns
Economic indicators impacting discretionary spending:
- Global inflation rate: 6.1%
- Consumer discretionary spending decline: 3.2%
- Average household entertainment budget reduction: 12.5%
Increasing Regulatory Challenges
Global regulatory landscape presents complex challenges:
| Region | Regulatory Challenge | Potential Impact |
|---|---|---|
| European Union | Local content quota requirements | 25% mandatory local content |
| India | Content censorship regulations | Potential content restrictions |
Subscriber Fatigue and Content Saturation
Subscriber retention metrics:
- Global subscriber churn rate: 4.7%
- Average subscription duration: 18 months
- New content requirement to maintain engagement: 50-60 new titles monthly
Disclaimer
All information, articles, and product details provided on this website are for general informational and educational purposes only. We do not claim any ownership over, nor do we intend to infringe upon, any trademarks, copyrights, logos, brand names, or other intellectual property mentioned or depicted on this site. Such intellectual property remains the property of its respective owners, and any references here are made solely for identification or informational purposes, without implying any affiliation, endorsement, or partnership.
We make no representations or warranties, express or implied, regarding the accuracy, completeness, or suitability of any content or products presented. Nothing on this website should be construed as legal, tax, investment, financial, medical, or other professional advice. In addition, no part of this site—including articles or product references—constitutes a solicitation, recommendation, endorsement, advertisement, or offer to buy or sell any securities, franchises, or other financial instruments, particularly in jurisdictions where such activity would be unlawful.
All content is of a general nature and may not address the specific circumstances of any individual or entity. It is not a substitute for professional advice or services. Any actions you take based on the information provided here are strictly at your own risk. You accept full responsibility for any decisions or outcomes arising from your use of this website and agree to release us from any liability in connection with your use of, or reliance upon, the content or products found herein.