
|
Sun TV Network Limited (SUNTV.NS): SWOT Analysis [Apr-2026 Updated] |
Fully Editable: Tailor To Your Needs In Excel Or Sheets
Professional Design: Trusted, Industry-Standard Templates
Investor-Approved Valuation Models
MAC/PC Compatible, Fully Unlocked
No Expertise Is Needed; Easy To Follow
Sun TV Network Limited (SUNTV.NS) Bundle
Sun TV Network sits on a powerful regional stronghold-dominant Tamil viewership, massive content library, pristine balance sheet and industry-leading margins-that funds sports and movie bets, yet its heavy southern revenue concentration, slow OTT monetization and dependence on linear ads expose it to cord‑cutting, rising content costs and a newly consolidated national rival; how Sun leverages its cash, expands digital reach (and 5G opportunities) while defending against regulatory and competitive pressure will determine whether it transforms into a pan‑India powerhouse or remains a regional specialist-read on to see the levers and risks.
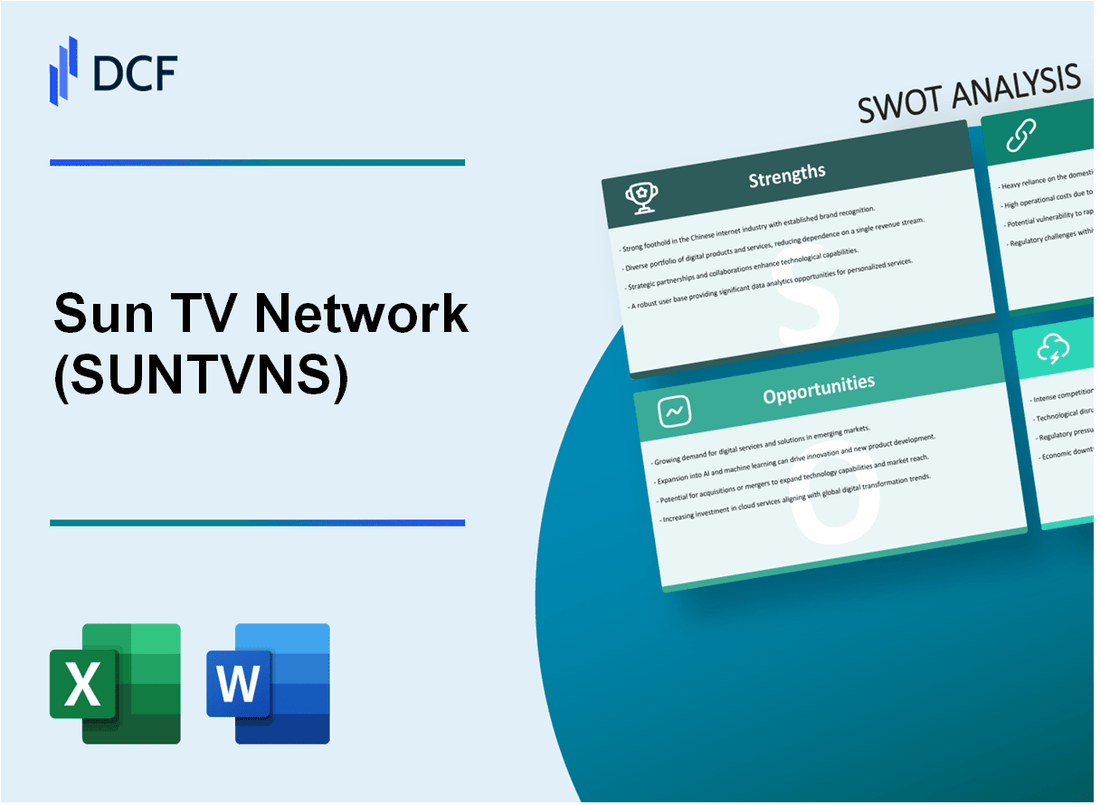
Sun TV Network Limited (SUNTV.NS) - SWOT Analysis: Strengths
Sun TV Network demonstrates dominant regional market leadership, holding a 49% viewership share in the Tamil market as of late 2025. The network's channel portfolio of 35 channels reaches over 145 million Indian households, with flagship Sun TV maintaining a consistent 20 percentage-point lead in GRPs over its nearest regional competitor. This scale enables a premium pricing strategy, delivering ad rates approximately 12% higher than other South Indian broadcasters and supporting annual advertisement revenue of ~2,300 crore INR.
| Metric | Value |
|---|---|
| Tamil market viewership share (2025) | 49% |
| Households reached | 145 million |
| Number of channels | 35 |
| Flagship GRP lead | 20 percentage points |
| Premium ad rate vs peers | +12% |
| Annual advertising revenue | ≈ 2,300 crore INR |
The company reports industry-leading operating profitability with an EBITDA margin of 64.5%, the highest in the Indian media sector. Cost discipline is evident: personnel costs remain below 8% of total revenue and internal content production accounts for 90% of output, minimizing external licensing fees. Return on capital employed (ROCE) is a robust 32%, supported by cash reserves of 1,850 crore INR, enabling both organic investments and selective inorganic opportunities.
| Financial Metric | Value |
|---|---|
| EBITDA margin | 64.5% |
| Personnel costs | <8% of revenue |
| Internal content production | 90% |
| Cash reserves | 1,850 crore INR |
| ROCE | 32% |
Sun TV has effectively monetized sports assets, notably through the Sunrisers Hyderabad IPL franchise, valued at USD 1.2 billion, and participation in the SA20 league. Sports-related revenues contributed 15% to total top-line growth in FY2025, with media rights income from sports growing 22% year-on-year. The sports segment currently generates an operating profit of 350 crore INR annually and captured ~10% of the emerging South African cricket viewership via SA20 involvement.
| Sports Metric | Value |
|---|---|
| Sunrisers Hyderabad valuation | USD 1.2 billion |
| Contribution to top-line growth (FY2025) | 15% |
| YOY media rights growth | 22% |
| Operating profit from sports | 350 crore INR |
| Share of SA cricket viewership captured | 10% |
Robust cash flow and liquidity characterize the balance sheet: zero long-term debt, free cash flow generation of 1,200 crore INR in the latest reporting cycle, and a current ratio of 3:1 versus an industry average of 1.5. The network maintains a consistent dividend payout ratio of 65% and funds annual investment in movie rights of ~550 crore INR from internal cash, preserving financial flexibility during interest-rate volatility.
| Liquidity & Capital Metrics | Value |
|---|---|
| Long-term debt | 0 |
| Free cash flow (latest) | 1,200 crore INR |
| Current ratio | 3.0 |
| Dividend payout ratio | 65% |
| Annual movie rights investment | 550 crore INR |
The network's expansive content library underpins recurring monetization: over 12,000 movie titles and 50,000 hours of original fiction content as of December 2025. Perpetual rights to 85% of its top-rated Tamil cinema catalog enhance long-term value. The library generates ~400 crore INR annually from syndication and international broadcast fees, while third-party platform monetization (including YouTube) has grown reach by 30% year-on-year, supporting subscriber retention on the Sun NXT digital platform.
| Content Library Metric | Value |
|---|---|
| Movie titles | 12,000+ |
| Original fiction hours | 50,000 hours |
| Perpetual rights to top Tamil films | 85% |
| Annual syndication & international fees | ≈ 400 crore INR |
| Third-party platform reach growth | +30% YOY |
Key strengths summarized:
- Market dominance in Tamil broadcast with 49% viewership share and 145M household reach.
- Best-in-class profitability: 64.5% EBITDA margin and ROCE of 32%.
- High-value sports assets (SRH valued at USD 1.2B) contributing diversified revenue and 350 crore INR operating profit.
- Strong liquidity: zero long-term debt, 1,200 crore INR free cash flow, 3:1 current ratio.
- Extensive content IP: 12,000+ movies, 50,000 hours fiction, generating ~400 crore INR annually.
Sun TV Network Limited (SUNTV.NS) - SWOT Analysis: Weaknesses
High geographic revenue concentration risk: Sun TV Network derives over 82% of total revenue from the four southern states of India (Tamil Nadu, Andhra Pradesh, Telangana, Kerala). The network's presence in North India is negligible, with market share under 2% in Hindi-speaking states. This regional concentration elevates exposure to localized economic cycles and state-level regulatory changes, particularly in Tamil Nadu where core ad spend has slowed.
| Metric | Value |
|---|---|
| Revenue share from four southern states | 82% |
| Market share in Hindi heartland | <2% |
| Ad revenue CAGR (Tamil segment, 3 yrs) | 4% |
| Combined revenue share from Marathi + Bengali attempts | <5% |
- Vulnerability: regional regulatory shifts in Tamil Nadu could impact >80% of revenue.
- Growth constraint: limited north expansion restricts national advertiser penetration.
- Concentration risk: macro slowdown in southern states translates directly to company topline volatility.
Slower digital platform monetization progress: Sun NXT reports 28 million active subscribers versus >100 million for larger competitors. Digital revenue is ~9% of total turnover, well below the ~25% peer average. High churn (18%) and a perceived lack of diverse non-southern originals depress engagement and ARPU. Current OTT technical infrastructure spend is INR 350 crore, which market benchmarks indicate is under-invested for a top-tier streaming service.
| Metric | Sun TV (Sun NXT) | Peer benchmark |
|---|---|---|
| Active subscribers | 28 million | >100 million |
| Digital revenue as % of total | 9% | ~25% |
| Churn rate | 18% | 8-12% (leading platforms) |
| OTT tech spend | INR 350 crore | INR 700-1,200 crore (leading regional/global players) |
| ARPU vs industry leader | ~40% lower | - |
- Revenue risk: low digital revenue share limits future-proofing against linear decline.
- Customer economics: high churn and low ARPU reduce lifetime value of subscribers.
- Investment gap: sub-scale tech spend constrains product features and scalability.
Dependence on traditional linear advertising: Approximately 60% of total income remains tied to linear TV advertising. Linear viewership among the 15-30 age group declined 12% year-on-year. Advertisers are reallocating budgets - an estimated 15% shift toward short-form and social platforms - and FMCG (55% of Sun TV's ad volume) is moving to performance-driven digital channels. Ad minutes sold growth has plateaued at ~1.5% annually.
| Metric | Value |
|---|---|
| Revenue from linear TV advertising | ~60% of total income |
| 15-30 age viewership change (12 months) | -12% |
| Advertiser budget shift to short-form/social | ~15% |
| FMCG share of ad volume | 55% |
| Ad minutes sold growth | 1.5% p.a. |
- Topline sensitivity: heavy reliance on a shrinking ad format undermines medium-term revenue stability.
- Client concentration: FMCG dependence heightens vulnerability to category-specific shifts in media strategy.
- Demographic gap: erosion in younger viewership weakens future reach and advertiser value proposition.
Limited diversification in content genres: Prime-time programming is dominated by daily soap operas occupying 75% of evening slots. Male viewership share during peak hours has dropped 10%. Reality content spend is ~20% below market average; competitors' investments in high-budget reality formats and international IP have broadened audience appeal. Fiction serial production costs have risen ~15% due to talent inflation, increasing cost-per-rating-point exposure.
| Metric | Value |
|---|---|
| Prime-time slot share for daily soaps | 75% |
| Male viewership change during peak hours | -10% |
| Reality content spend vs market average | -20% |
| Increase in serial production costs | +15% |
- Audience risk: narrow genre mix increases susceptibility to taste shifts and fatigue.
- Competitive disadvantage: under-investment in unscripted/high-value formats limits cross-demographic reach.
- Cost pressure: rising production costs compress margins on core fiction inventory.
High promoter holding and governance perception: The promoter group holds 75% stake (the regulatory cap), leaving a free float of ~25% which depresses liquidity and institutional weighting. Executive compensation levels rank among the highest in the Indian corporate sector. ESG indicators place the company in the lower quartile within the Nifty 500 media universe due to limited independent board oversight. The stock trades at ~20% discount versus its five‑year average P/E, partly reflecting governance-driven valuation drag.
| Metric | Value |
|---|---|
| Promoter holding | 75% |
| Free float | 25% |
| Relative stock valuation vs 5‑yr avg P/E | -20% discount |
| ESG quartile (Nifty 500 media) | Lower quartile |
| Executive compensation (relative) | Among highest in Indian corporates |
- Liquidity & ownership: high promoter concentration limits secondary market depth and index inclusion potential.
- Investor perception: governance and compensation concerns weigh on institutional demand and valuation multiples.
- ESG risk: weaker governance metrics could limit access to ESG-focused capital and passive flows.
Sun TV Network Limited (SUNTV.NS) - SWOT Analysis: Opportunities
Aggressive digital content expansion strategy presents a scalable revenue runway as the Indian OTT market is projected to reach USD 5.0 billion by 2026. Sun NXT has allocated INR 600 crore to produce 20 original web series across four languages over the next 12 months, targeting accelerated subscriber acquisition in Tier 2 and Tier 3 cities where OTT penetration is expected to rise by 25% alongside falling data costs. Integration with regional telecom bundles aims to double subscriber base from ~25 million to 50 million by 2027, shifting digital revenue contribution from current estimates (circa 8-10%) toward a target of 20% of consolidated revenues.
The following table summarizes key digital expansion targets and projected financial impact:
| Metric | Current / Baseline | Target / Projection | Timeframe |
|---|---|---|---|
| Indian OTT market value | USD ~3.0 billion (2024 est.) | USD 5.0 billion | By 2026 |
| Sun NXT content budget | INR 0 (new allocation) | INR 600 crore | Next 12 months |
| Original web series | Existing slate (single digits) | 20 series across 4 languages | 12 months |
| Subscribers | ~25 million | 50 million | By 2027 |
| Digital revenue contribution | 8-10% | 20% | By 2027 |
Upside from movie production investments is material given Sun Pictures' planned slate of six mega-budget films for FY2026 with a combined capex of INR 800 crore. Historical franchise and blockbuster performance indicate potential project-level ROI of ~40% via theatrical, satellite, and digital rights monetization. Cross-border and pan-India distribution has increased contract values by ~50% over two years, and regional films now derive ~30% of revenues from North Indian markets, supporting an incremental revenue potential of ~INR 500 crore annually from the movie segment.
- Planned film slate: 6 films, total budget INR 800 crore (FY2026).
- Expected average ROI: ~40% per successful project.
- Incremental contribution: INR 500 crore annually (conservative estimate).
- Global distribution contract value growth: +50% vs. two years prior.
Increasing penetration in niche markets offers diversified ad and subscription revenues. Sun TV currently holds ~5% share in targeted segments (kids, infotainment, lifestyle). The regional kids entertainment market is growing at ~12% CAGR, while Sun TV's 50,000‑hour content library enables rapid channelization with low incremental content cost. Entry into Marathi language markets can unlock advertising opportunities estimated at INR 1,500 crore. These initiatives are expected to broaden the revenue mix by an incremental ~10% within two years.
| Opportunity Area | Current Share | Market CAGR / Growth | Projected Revenue Impact |
|---|---|---|---|
| Kids channels | ~5% | 12% CAGR | Incremental ad/sub revenue; part of 10% revenue diversification |
| Infotainment & lifestyle | ~5% combined | 8-10% (regional demand) | Improved ARPU and ad yields |
| Marathi market entry | Minimal presence | Regional ad market expanding | Access to ~INR 1,500 crore advertising pie |
| Content library leverage | 50,000 hours | NA | Low incremental cost channel launches |
Monetization of the 5G rollout is a strategic lever to enhance mobile video consumption and ad monetization. Nationwide 5G penetration will enable HD/4K streaming to mobile devices, tripling per-user data consumption estimates and enabling exclusive short-form 'snackable' content tied to operator bundles. Sun TV targets a 15% uplift in mobile engagement via 5G partnerships, while interactive ad formats could lift digital ad rates by ~20% through improved targeting and attribution. Ongoing tests include cloud-based gaming integrated into the OTT app to address the ~400 million Indian gamers market. Over the long term, 5G-enabled CDN and edge computing adoption could reduce content delivery costs by ~15%.
- Expected increase in mobile data consumption per user: ~3x with 5G.
- Projected mobile engagement uplift via exclusive 5G content: ~15%.
- Potential digital ad rate increase through interactivity: ~20%.
- Content delivery cost reduction target via 5G/CDN: ~15%.
- Addressable gaming audience for cloud-gaming integration: ~400 million users in India.
Sun TV Network Limited (SUNTV.NS) - SWOT Analysis: Threats
The merger of Reliance's Viacom18 and Disney Star has created a consolidated competitor with an estimated ~40% combined national market share and a reported content budget of approximately US$2.0 billion annually. This scale advantage enables integrated cross-platform ad packages across TV and digital that Sun TV cannot currently match. Early market effects include a ~5% reduction in Sun TV's national advertiser wallet share and heightened risk from the merged entity's control of premium sports rights, which could materially reduce regional sports viewership and related ad revenue.
| Metric | Viacom18+Disney Star | Sun TV (approx.) | Near-term Impact |
|---|---|---|---|
| Combined market share | ~40% | ~10-12% (national); dominant in South | Higher national ad competition |
| Annual content budget | US$2.0 billion | US$100-200 million (est.) | Content quality and volume gap |
| Advertiser wallet shift | - | -5% (observed) | Reduced ad rates/volume |
| Sports rights control | Consolidated | Limited | Loss of regional sports viewership |
Cord-cutting and a structural shift toward digital consumption are eroding the traditional linear TV base in India. Pay-TV households in urban markets are declining at ~7% per annum; Connected TV (CTV) advertising is expanding at ~35% annually, diverting budgets from regional linear broadcasters. If trends persist, linear TV reach in South India could fall below 70% by 2027. Short-form platforms have reduced average time spent on general entertainment channels (GECs) by roughly 20 minutes per day, undermining the high-margin linear advertising model that underpins Sun TV's profitability.
- Pay-TV household decline: ~7% CAGR (urban).
- CTV ad growth: ~35% YoY.
- Projected linear TV reach (South India) by 2027: <70%.
- GEC time-spent reduction: ~20 minutes/day.
Regulatory changes are constraining pricing power. TRAI's NTO 3.0 imposes a Rs.19 cap on channel prices within bouquets, limiting subscription upside-subscription revenue growth is currently stagnant at ~2% annually. Proposed mandates on content-sharing, ad-cap restrictions, or stricter must-carry rules could compress operating margins by an estimated 300 basis points. Compliance with new data privacy requirements is expected to add roughly Rs.50 crore in annual costs. Additionally, any shift in government regional-language broadcast policy could disrupt distribution economics and revenue flows.
| Regulatory Factor | Estimated Impact | Financial Effect |
|---|---|---|
| NTO 3.0 price cap | Limits ARPU growth | Subscription growth ~2% pa |
| Potential ad-cap/content sharing | Reduced ad inventory value | Margin compression ~300 bps |
| Data privacy compliance | Higher Opex | ~Rs.50 crore/year |
| Regional broadcast policy changes | Distribution disruption | Revenue volatility (quantification uncertain) |
Content and talent costs are rising sharply. Satellite rights for A-list regional films have increased ~40% over two years due to OTT competition. High-quality original series production costs are now ~Rs.1.5 crore per episode (up ~25% from 2023). Top regional talent fees have inflated ~30%, and marketing/promotional inflation stands at ~12% YoY. With existing EBITDA margins exceeding 60%, these input cost pressures could cause a ~5% contraction in net profit margins if advertising growth remains muted.
- Satellite rights inflation: +40% (2 years).
- Production cost per episode: ~Rs.1.5 crore (+25% vs 2023).
- Talent fee inflation: +30%.
- Marketing cost inflation: +12% YoY.
- Potential net margin impact: -~5% if ad growth stagnates.
Macro volatility presents additional downside risk. Rural demand-accounting for ~45% of Sun TV's viewership-is sensitive to economic cycles; a 1% decline in GDP growth historically corresponds to ~1.5% contraction in regional media ad budgets. Inflation has increased costs for technical equipment and broadcasting hardware by ~10%. Global economic uncertainty could also affect valuations and sponsorship revenue related to sports assets (e.g., IPL franchise exposure). Quarterly earnings have exhibited a standard deviation of ~5% in recent years, reflecting this external volatility.
| Macro Indicator | Observed Effect | Quantified Impact |
|---|---|---|
| Rural viewership exposure | High (≈45% of viewers) | Ad budgets sensitive to rural demand |
| GDP growth sensitivity | Regional ad budgets | 1% GDP ↓ → 1.5% ad budget ↓ |
| Inflation impact on capex | Higher hardware costs | ~+10% equipment cost |
| Earnings volatility | Quarterly variability | Std. dev. ≈5% |
Disclaimer
All information, articles, and product details provided on this website are for general informational and educational purposes only. We do not claim any ownership over, nor do we intend to infringe upon, any trademarks, copyrights, logos, brand names, or other intellectual property mentioned or depicted on this site. Such intellectual property remains the property of its respective owners, and any references here are made solely for identification or informational purposes, without implying any affiliation, endorsement, or partnership.
We make no representations or warranties, express or implied, regarding the accuracy, completeness, or suitability of any content or products presented. Nothing on this website should be construed as legal, tax, investment, financial, medical, or other professional advice. In addition, no part of this site—including articles or product references—constitutes a solicitation, recommendation, endorsement, advertisement, or offer to buy or sell any securities, franchises, or other financial instruments, particularly in jurisdictions where such activity would be unlawful.
All content is of a general nature and may not address the specific circumstances of any individual or entity. It is not a substitute for professional advice or services. Any actions you take based on the information provided here are strictly at your own risk. You accept full responsibility for any decisions or outcomes arising from your use of this website and agree to release us from any liability in connection with your use of, or reliance upon, the content or products found herein.