
|
Digital China Group Co. ، Ltd. (000034.SZ) تقييم DCF |
Fully Editable: Tailor To Your Needs In Excel Or Sheets
Professional Design: Trusted, Industry-Standard Templates
Investor-Approved Valuation Models
MAC/PC Compatible, Fully Unlocked
No Expertise Is Needed; Easy To Follow
Digital China Group Co., Ltd. (000034.SZ) Bundle
Looking to determine the intrinsic value of Digital China Group Co., Ltd.? Our (000034SZ) DCF Calculator integrates real-world data with customizable features, allowing you to refine your forecasts and enhance your investment strategies.
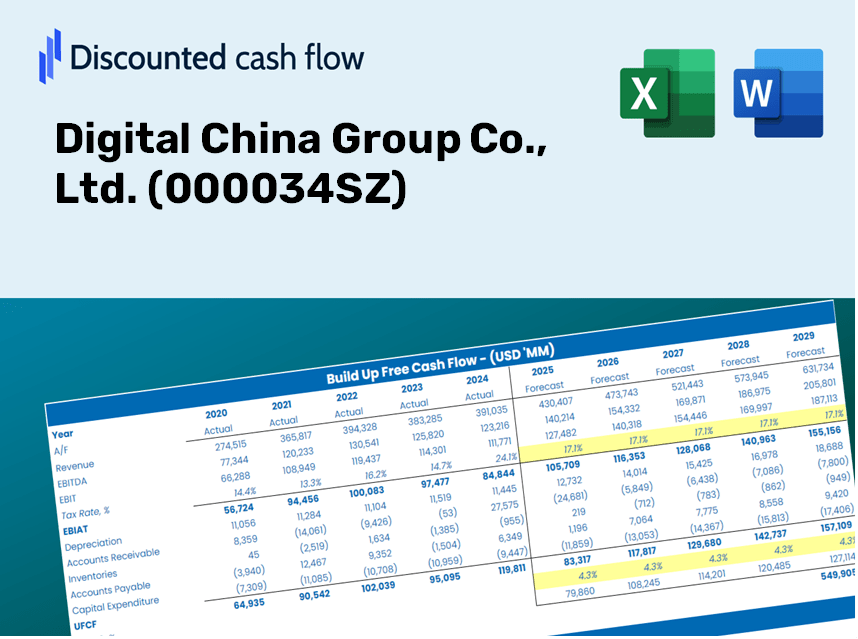
Discounted Cash Flow (DCF) - (USD MM)
| Year | AY1 2020 |
AY2 2021 |
AY3 2022 |
AY4 2023 |
AY5 2024 |
FY1 2025 |
FY2 2026 |
FY3 2027 |
FY4 2028 |
FY5 2029 |
|---|---|---|---|---|---|---|---|---|---|---|
| Revenue | 92,060.4 | 122,384.9 | 115,880.0 | 119,623.9 | 128,166.4 | 140,341.1 | 153,672.3 | 168,269.8 | 184,254.0 | 201,756.6 |
| Revenue Growth, % | 0 | 32.94 | -5.32 | 3.23 | 7.14 | 9.5 | 9.5 | 9.5 | 9.5 | 9.5 |
| EBITDA | 1,335.0 | 1,455.5 | 1,807.4 | 2,114.5 | 2,237.1 | 2,164.7 | 2,370.3 | 2,595.5 | 2,842.0 | 3,112.0 |
| EBITDA, % | 1.45 | 1.19 | 1.56 | 1.77 | 1.75 | 1.54 | 1.54 | 1.54 | 1.54 | 1.54 |
| Depreciation | 58.7 | 81.4 | 64.8 | 55.2 | 103.6 | 87.9 | 96.2 | 105.4 | 115.4 | 126.3 |
| Depreciation, % | 0.06375278 | 0.06648217 | 0.05587836 | 0.04616578 | 0.08082042 | 0.0626199 | 0.0626199 | 0.0626199 | 0.0626199 | 0.0626199 |
| EBIT | 1,276.3 | 1,374.1 | 1,742.7 | 2,059.3 | 2,133.5 | 2,076.8 | 2,274.1 | 2,490.1 | 2,726.7 | 2,985.7 |
| EBIT, % | 1.39 | 1.12 | 1.5 | 1.72 | 1.66 | 1.48 | 1.48 | 1.48 | 1.48 | 1.48 |
| Total Cash | 4,097.7 | 4,614.2 | 4,321.8 | 5,644.8 | 5,660.2 | 5,918.5 | 6,480.7 | 7,096.3 | 7,770.4 | 8,508.5 |
| Total Cash, percent | .0 | .0 | .0 | .0 | .0 | .0 | .0 | .0 | .0 | .0 |
| Account Receivables | 8,370.8 | 9,003.9 | 9,424.3 | 12,604.9 | 13,969.8 | 12,916.8 | 14,143.8 | 15,487.3 | 16,958.5 | 18,569.4 |
| Account Receivables, % | 9.09 | 7.36 | 8.13 | 10.54 | 10.9 | 9.2 | 9.2 | 9.2 | 9.2 | 9.2 |
| Inventories | 9,560.4 | 14,553.6 | 12,495.0 | 12,337.7 | 12,616.2 | 14,937.0 | 16,355.8 | 17,909.5 | 19,610.8 | 21,473.6 |
| Inventories, % | 10.38 | 11.89 | 10.78 | 10.31 | 9.84 | 10.64 | 10.64 | 10.64 | 10.64 | 10.64 |
| Accounts Payable | 10,117.4 | 13,531.8 | 10,904.4 | 12,600.5 | 14,155.8 | 14,886.0 | 16,300.0 | 17,848.4 | 19,543.9 | 21,400.4 |
| Accounts Payable, % | 10.99 | 11.06 | 9.41 | 10.53 | 11.04 | 10.61 | 10.61 | 10.61 | 10.61 | 10.61 |
| Capital Expenditure | -304.5 | -366.3 | -242.4 | -407.8 | -588.1 | -460.0 | -503.7 | -551.6 | -604.0 | -661.4 |
| Capital Expenditure, % | -0.33076 | -0.29931 | -0.2092 | -0.34088 | -0.45886 | -0.3278 | -0.3278 | -0.3278 | -0.3278 | -0.3278 |
| Tax Rate, % | 19.94 | 19.94 | 19.94 | 19.94 | 19.94 | 19.94 | 19.94 | 19.94 | 19.94 | 19.94 |
| EBITAT | 956.4 | 661.1 | 1,322.3 | 1,594.9 | 1,708.2 | 1,480.5 | 1,621.1 | 1,775.1 | 1,943.8 | 2,128.4 |
| Depreciation | ||||||||||
| Changes in Account Receivables | ||||||||||
| Changes in Inventories | ||||||||||
| Changes in Accounts Payable | ||||||||||
| Capital Expenditure | ||||||||||
| UFCF | -7,103.3 | -1,835.7 | 155.4 | -84.8 | 1,135.5 | 570.8 | -18.2 | -19.9 | -21.8 | -23.9 |
| WACC, % | 4.46 | 3.85 | 4.48 | 4.52 | 4.58 | 4.38 | 4.38 | 4.38 | 4.38 | 4.38 |
| PV UFCF | ||||||||||
| SUM PV UFCF | 474.9 | |||||||||
| Long Term Growth Rate, % | 3.00 | |||||||||
| Free cash flow (T + 1) | -25 | |||||||||
| Terminal Value | -1,783 | |||||||||
| Present Terminal Value | -1,439 | |||||||||
| Enterprise Value | -964 | |||||||||
| Net Debt | 10,465 | |||||||||
| Equity Value | -11,429 | |||||||||
| Diluted Shares Outstanding, MM | 664 | |||||||||
| Equity Value Per Share | -17.22 |
What You Will Receive
- Adjustable Forecast Inputs: Modify key assumptions (growth %, margins, WACC) effortlessly to explore various scenarios.
- Current Financial Data: Pre-loaded financial figures for Digital China Group Co., Ltd. (000034SZ) to facilitate your analysis.
- Automated DCF Calculations: The template computes Net Present Value (NPV) and intrinsic value automatically for your convenience.
- Professional and Customizable: A sleek Excel model tailored to meet your valuation requirements.
- Designed for Analysts and Investors: Perfect for testing forecasts, validating strategies, and optimizing efficiency.
Key Features
- Current Digital China Data: Pre-filled with Digital China's historical financials and future projections.
- Customizable Parameters: Tailor revenue growth, profit margins, WACC, tax rates, and capital expenditures to your needs.
- Adaptive Valuation Model: Automatically recalibrates Net Present Value (NPV) and intrinsic value based on your inputs.
- Scenario Analysis: Develop various forecast scenarios to assess different valuation outcomes.
- User-Friendly Interface: Intuitive and organized, suitable for both professionals and newcomers.
How It Functions
- Step 1: Download the prebuilt Excel template containing Digital China Group Co., Ltd.'s data.
- Step 2: Navigate through the pre-filled sheets to familiarize yourself with the key metrics.
- Step 3: Adjust forecasts and assumptions in the editable yellow cells (WACC, growth, margins).
- Step 4: Instantly view the recalculated results, including the intrinsic value of Digital China Group Co., Ltd. (000034SZ).
- Step 5: Use the outputs to make informed investment decisions or create detailed reports.
Why Choose This Calculator for Digital China Group Co., Ltd. (000034SZ)?
- User-Friendly Interface: Crafted for both novices and seasoned professionals.
- Customizable Inputs: Easily adjust parameters to suit your analytical needs.
- Real-Time Valuation Updates: Observe immediate adjustments to Digital China’s valuation with input changes.
- Pre-Loaded Financial Data: Comes equipped with Digital China’s current financial metrics for swift evaluations.
- Endorsed by Experts: Favored by investors and analysts for making informed choices.
Who Can Benefit from Digital China Group Co., Ltd. (000034SZ)?
- Investors: Make informed investment choices with a high-quality valuation tool tailored for Digital China.
- Financial Analysts: Streamline your workflow with a pre-designed DCF model that can be easily customized for Digital China’s financials.
- Consultants: Effortlessly modify the template for client presentations or analytical reports focused on Digital China.
- Finance Enthusiasts: Enhance your knowledge of valuation methods through practical, real-world cases involving Digital China.
- Educators and Students: Utilize this resource as an effective learning aid in finance courses related to Digital China Group Co., Ltd.
What the Template Contains
- Historical Data: Includes Digital China Group Co., Ltd.'s past financials and baseline forecasts.
- DCF and Levered DCF Models: Detailed templates to calculate Digital China Group Co., Ltd.'s intrinsic value.
- WACC Sheet: Pre-built calculations for Weighted Average Cost of Capital.
- Editable Inputs: Modify key drivers such as growth rates, EBITDA %, and CAPEX assumptions.
- Quarterly and Annual Statements: A complete breakdown of Digital China Group Co., Ltd.'s financials.
- Interactive Dashboard: Visualize valuation results and projections dynamically.
Disclaimer
All information, articles, and product details provided on this website are for general informational and educational purposes only. We do not claim any ownership over, nor do we intend to infringe upon, any trademarks, copyrights, logos, brand names, or other intellectual property mentioned or depicted on this site. Such intellectual property remains the property of its respective owners, and any references here are made solely for identification or informational purposes, without implying any affiliation, endorsement, or partnership.
We make no representations or warranties, express or implied, regarding the accuracy, completeness, or suitability of any content or products presented. Nothing on this website should be construed as legal, tax, investment, financial, medical, or other professional advice. In addition, no part of this site—including articles or product references—constitutes a solicitation, recommendation, endorsement, advertisement, or offer to buy or sell any securities, franchises, or other financial instruments, particularly in jurisdictions where such activity would be unlawful.
All content is of a general nature and may not address the specific circumstances of any individual or entity. It is not a substitute for professional advice or services. Any actions you take based on the information provided here are strictly at your own risk. You accept full responsibility for any decisions or outcomes arising from your use of this website and agree to release us from any liability in connection with your use of, or reliance upon, the content or products found herein.