
|
XCMG Construction Machinery Co. ، Ltd. (000425.SZ) تقييم DCF |
Fully Editable: Tailor To Your Needs In Excel Or Sheets
Professional Design: Trusted, Industry-Standard Templates
Investor-Approved Valuation Models
MAC/PC Compatible, Fully Unlocked
No Expertise Is Needed; Easy To Follow
XCMG Construction Machinery Co., Ltd. (000425.SZ) Bundle
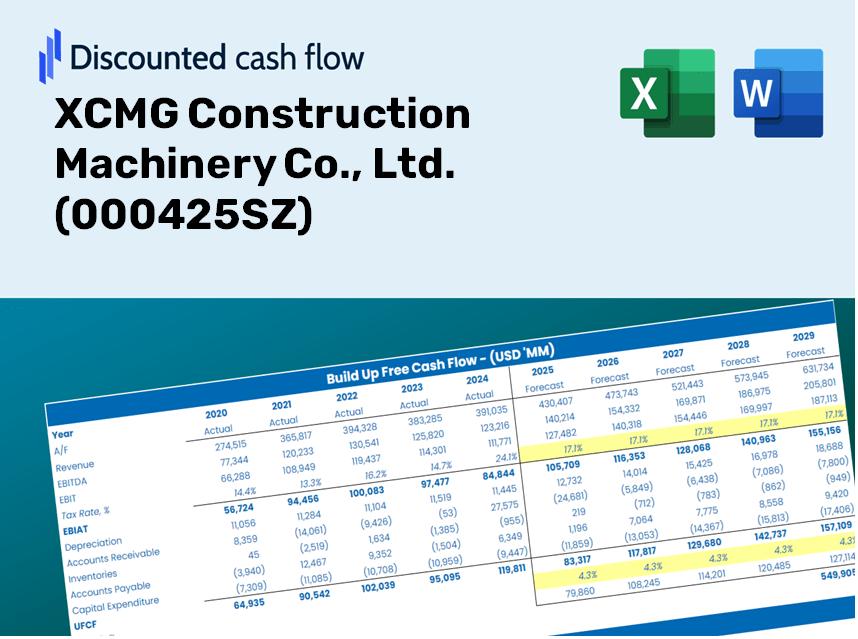
Looking to determine the intrinsic value of XCMG Construction Machinery Co., Ltd.? Our (000425SZ) DCF Calculator integrates real-world data with comprehensive customization features, allowing you to adjust forecasts and enhance your investment decisions.
Discounted Cash Flow (DCF) - (USD MM)
| Year | AY1 2020 |
AY2 2021 |
AY3 2022 |
AY4 2023 |
AY5 2024 |
FY1 2025 |
FY2 2026 |
FY3 2027 |
FY4 2028 |
FY5 2029 |
|---|---|---|---|---|---|---|---|---|---|---|
| Revenue | 73,968.1 | 116,796.2 | 93,817.1 | 92,848.2 | 91,659.8 | 99,889.3 | 108,857.7 | 118,631.3 | 129,282.5 | 140,889.9 |
| Revenue Growth, % | 0 | 57.9 | -19.67 | -1.03 | -1.28 | 8.98 | 8.98 | 8.98 | 8.98 | 8.98 |
| EBITDA | 5,633.5 | 11,325.7 | 8,162.8 | 9,420.1 | 11,698.9 | 9,773.7 | 10,651.3 | 11,607.6 | 12,649.7 | 13,785.5 |
| EBITDA, % | 7.62 | 9.7 | 8.7 | 10.15 | 12.76 | 9.78 | 9.78 | 9.78 | 9.78 | 9.78 |
| Depreciation | 1,168.0 | 2,970.9 | 3,548.9 | 3,947.3 | 3,448.5 | 3,180.3 | 3,465.8 | 3,777.0 | 4,116.1 | 4,485.7 |
| Depreciation, % | 1.58 | 2.54 | 3.78 | 4.25 | 3.76 | 3.18 | 3.18 | 3.18 | 3.18 | 3.18 |
| EBIT | 4,465.5 | 8,354.8 | 4,613.9 | 5,472.8 | 8,250.4 | 6,593.5 | 7,185.5 | 7,830.6 | 8,533.6 | 9,299.8 |
| EBIT, % | 6.04 | 7.15 | 4.92 | 5.89 | 9 | 6.6 | 6.6 | 6.6 | 6.6 | 6.6 |
| Total Cash | 17,244.3 | 23,240.5 | 34,479.9 | 23,410.2 | 20,244.7 | 25,424.6 | 27,707.3 | 30,195.0 | 32,906.0 | 35,860.4 |
| Total Cash, percent | .0 | .0 | .0 | .0 | .0 | .0 | .0 | .0 | .0 | .0 |
| Account Receivables | 37,879.0 | 59,081.5 | 49,481.7 | 47,194.5 | 48,031.5 | 51,496.8 | 56,120.4 | 61,159.1 | 66,650.1 | 72,634.2 |
| Account Receivables, % | 51.21 | 50.59 | 52.74 | 50.83 | 52.4 | 51.55 | 51.55 | 51.55 | 51.55 | 51.55 |
| Inventories | 13,060.7 | 16,827.8 | 35,099.5 | 32,378.4 | 32,543.5 | 27,940.0 | 30,448.5 | 33,182.3 | 36,161.5 | 39,408.2 |
| Inventories, % | 17.66 | 14.41 | 37.41 | 34.87 | 35.5 | 27.97 | 27.97 | 27.97 | 27.97 | 27.97 |
| Accounts Payable | 32,621.7 | 56,875.7 | 50,383.2 | 41,844.0 | 41,366.0 | 47,287.5 | 51,533.2 | 56,160.0 | 61,202.2 | 66,697.2 |
| Accounts Payable, % | 44.1 | 48.7 | 53.7 | 45.07 | 45.13 | 47.34 | 47.34 | 47.34 | 47.34 | 47.34 |
| Capital Expenditure | -2,052.8 | -3,272.7 | -7,985.6 | -5,966.8 | -2,938.4 | -4,739.0 | -5,164.5 | -5,628.2 | -6,133.5 | -6,684.2 |
| Capital Expenditure, % | -2.78 | -2.8 | -8.51 | -6.43 | -3.21 | -4.74 | -4.74 | -4.74 | -4.74 | -4.74 |
| Tax Rate, % | 9.21 | 9.21 | 9.21 | 9.21 | 9.21 | 9.21 | 9.21 | 9.21 | 9.21 | 9.21 |
| EBITAT | 3,876.1 | 7,429.8 | 3,969.3 | 5,134.3 | 7,490.7 | 5,886.2 | 6,414.7 | 6,990.6 | 7,618.2 | 8,302.2 |
| Depreciation | ||||||||||
| Changes in Account Receivables | ||||||||||
| Changes in Inventories | ||||||||||
| Changes in Accounts Payable | ||||||||||
| Capital Expenditure | ||||||||||
| UFCF | -15,326.8 | 6,412.3 | -15,631.6 | -416.3 | 6,520.9 | 11,387.1 | 1,829.5 | 1,993.8 | 2,172.8 | 2,367.9 |
| WACC, % | 6.06 | 6.08 | 6.05 | 6.12 | 6.09 | 6.08 | 6.08 | 6.08 | 6.08 | 6.08 |
| PV UFCF | ||||||||||
| SUM PV UFCF | 17,509.2 | |||||||||
| Long Term Growth Rate, % | 3.00 | |||||||||
| Free cash flow (T + 1) | 2,439 | |||||||||
| Terminal Value | 79,197 | |||||||||
| Present Terminal Value | 58,959 | |||||||||
| Enterprise Value | 76,469 | |||||||||
| Net Debt | 12,026 | |||||||||
| Equity Value | 64,443 | |||||||||
| Diluted Shares Outstanding, MM | 11,718 | |||||||||
| Equity Value Per Share | 5.50 |
Benefits of Choosing Us
- Flexible Forecast Inputs: Effortlessly adjust parameters (growth %, margins, WACC) to explore various scenarios.
- Accurate Financial Data: XCMG’s financial data pre-populated to kickstart your analysis.
- Instant DCF Outputs: The template automatically computes Net Present Value (NPV) and intrinsic value for you.
- Tailored and Professional: A sophisticated Excel model designed to meet your valuation requirements.
- Designed for Analysts and Investors: Perfect for testing projections, validating strategies, and enhancing efficiency.
Key Features
- Pre-Loaded Data: Historical financial statements and pre-filled forecasts for XCMG Construction Machinery Co., Ltd. (000425SZ).
- Fully Adjustable Inputs: Tailor WACC, tax rates, revenue growth, and EBITDA margins according to your analysis.
- Instant Results: Watch the intrinsic value of XCMG Construction Machinery Co., Ltd. (000425SZ) update in real time.
- Clear Visual Outputs: Dashboard charts present valuation results and essential metrics clearly.
- Built for Accuracy: A professional-grade tool designed for analysts, investors, and finance professionals.
How It Operates
- Download: Obtain the pre-formatted Excel file featuring XCMG Construction Machinery's financial data.
- Customize: Modify predictions, including revenue growth, EBITDA margin, and WACC.
- Update Automatically: The calculations for intrinsic value and NPV refresh in real-time.
- Test Scenarios: Develop various projections and instantly analyze the results.
- Make Decisions: Leverage the valuation insights to inform your investment approach.
Why Choose This Calculator for XCMG Construction Machinery Co., Ltd. (000425SZ)?
- Accurate Data: Real XCMG financials provide dependable valuation results.
- Customizable: Tailor key parameters such as growth rates, WACC, and tax rates to fit your forecasts.
- Time-Saving: Pre-configured calculations save you the hassle of starting from scratch.
- Professional-Grade Tool: Crafted for investors, analysts, and consultants in the construction machinery sector.
- User-Friendly: Intuitive design and clear, step-by-step instructions ensure accessibility for all users.
Who Can Benefit from This Product?
- Investors: Assess XCMG Construction Machinery Co., Ltd.’s valuation before making stock transactions.
- CFOs and Financial Analysts: Optimize valuation workflows and evaluate financial forecasts.
- Startup Founders: Understand the valuation methods applied to leading public companies like XCMG (000425SZ).
- Consultants: Create detailed valuation reports for your clients based on XCMG's financial data.
- Students and Educators: Utilize real-time data to practice and teach valuation methodologies effectively.
Contents of the Template
- Pre-Filled Data: Contains XCMG's historical financial data and projections.
- Discounted Cash Flow Model: Editable DCF valuation model featuring automatic calculations.
- Weighted Average Cost of Capital (WACC): A dedicated sheet for calculating WACC using customized inputs.
- Key Financial Ratios: Evaluate XCMG's profitability, operational efficiency, and financial leverage.
- Customizable Inputs: Easily modify revenue growth rates, profit margins, and tax percentages.
- Clear Dashboard: Visuals and tables showcasing essential valuation outcomes.
Disclaimer
All information, articles, and product details provided on this website are for general informational and educational purposes only. We do not claim any ownership over, nor do we intend to infringe upon, any trademarks, copyrights, logos, brand names, or other intellectual property mentioned or depicted on this site. Such intellectual property remains the property of its respective owners, and any references here are made solely for identification or informational purposes, without implying any affiliation, endorsement, or partnership.
We make no representations or warranties, express or implied, regarding the accuracy, completeness, or suitability of any content or products presented. Nothing on this website should be construed as legal, tax, investment, financial, medical, or other professional advice. In addition, no part of this site—including articles or product references—constitutes a solicitation, recommendation, endorsement, advertisement, or offer to buy or sell any securities, franchises, or other financial instruments, particularly in jurisdictions where such activity would be unlawful.
All content is of a general nature and may not address the specific circumstances of any individual or entity. It is not a substitute for professional advice or services. Any actions you take based on the information provided here are strictly at your own risk. You accept full responsibility for any decisions or outcomes arising from your use of this website and agree to release us from any liability in connection with your use of, or reliance upon, the content or products found herein.