
|
شركة Changhong Meiling Co.، Ltd. (000521.SZ) تقييم DCF |
Fully Editable: Tailor To Your Needs In Excel Or Sheets
Professional Design: Trusted, Industry-Standard Templates
Investor-Approved Valuation Models
MAC/PC Compatible, Fully Unlocked
No Expertise Is Needed; Easy To Follow
Changhong Meiling Co., Ltd. (000521.SZ) Bundle
Looking to assess the intrinsic value of Changhong Meiling Co., Ltd.? Our (000521SZ) DCF Calculator integrates real-world data with complete customization options, enabling you to refine your forecasts and enhance your investment strategies.
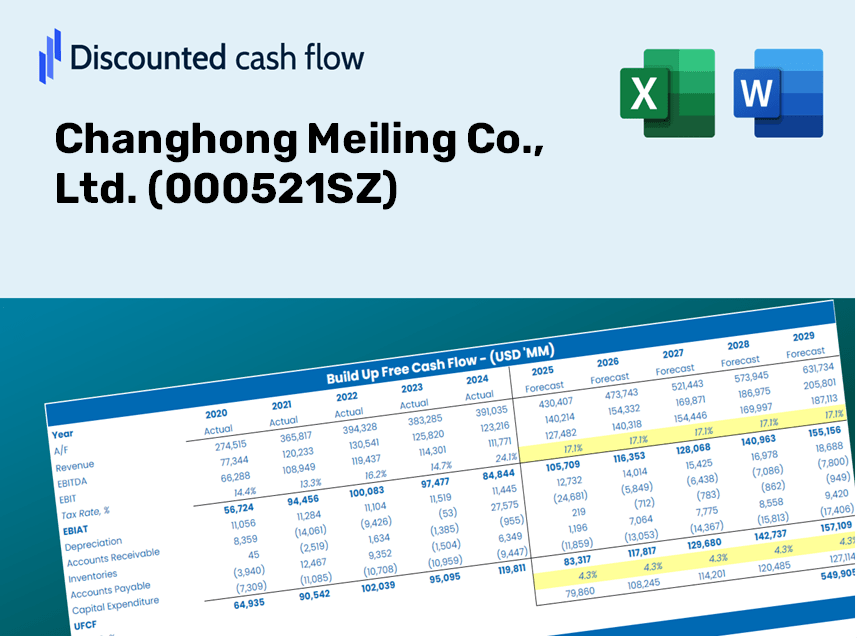
Discounted Cash Flow (DCF) - (USD MM)
| Year | AY1 2020 |
AY2 2021 |
AY3 2022 |
AY4 2023 |
AY5 2024 |
FY1 2025 |
FY2 2026 |
FY3 2027 |
FY4 2028 |
FY5 2029 |
|---|---|---|---|---|---|---|---|---|---|---|
| Revenue | 15,388.1 | 18,033.0 | 20,215.2 | 24,247.7 | 28,601.0 | 33,405.4 | 39,016.7 | 45,570.6 | 53,225.5 | 62,166.1 |
| Revenue Growth, % | 0 | 17.19 | 12.1 | 19.95 | 17.95 | 16.8 | 16.8 | 16.8 | 16.8 | 16.8 |
| EBITDA | 379.5 | 530.6 | 705.1 | 1,194.8 | 1,249.0 | 1,215.4 | 1,419.5 | 1,658.0 | 1,936.5 | 2,261.8 |
| EBITDA, % | 2.47 | 2.94 | 3.49 | 4.93 | 4.37 | 3.64 | 3.64 | 3.64 | 3.64 | 3.64 |
| Depreciation | 360.9 | 375.7 | 388.0 | 388.2 | 414.3 | 627.8 | 733.3 | 856.5 | 1,000.3 | 1,168.4 |
| Depreciation, % | 2.35 | 2.08 | 1.92 | 1.6 | 1.45 | 1.88 | 1.88 | 1.88 | 1.88 | 1.88 |
| EBIT | 18.7 | 154.9 | 317.1 | 806.6 | 834.6 | 587.5 | 686.2 | 801.5 | 936.1 | 1,093.4 |
| EBIT, % | 0.12132 | 0.85915 | 1.57 | 3.33 | 2.92 | 1.76 | 1.76 | 1.76 | 1.76 | 1.76 |
| Total Cash | 6,642.0 | 5,956.8 | 6,897.1 | 8,879.9 | 10,854.2 | 12,352.4 | 14,427.3 | 16,850.8 | 19,681.4 | 22,987.4 |
| Total Cash, percent | .0 | .0 | .0 | .0 | .0 | .0 | .0 | .0 | .0 | .0 |
| Account Receivables | 3,433.1 | 3,251.2 | 2,756.8 | 3,289.1 | 3,183.1 | 5,256.0 | 6,138.9 | 7,170.1 | 8,374.6 | 9,781.3 |
| Account Receivables, % | 22.31 | 18.03 | 13.64 | 13.56 | 11.13 | 15.73 | 15.73 | 15.73 | 15.73 | 15.73 |
| Inventories | 1,715.4 | 1,356.4 | 1,710.3 | 2,022.7 | 3,515.0 | 3,190.9 | 3,727.0 | 4,353.0 | 5,084.2 | 5,938.2 |
| Inventories, % | 11.15 | 7.52 | 8.46 | 8.34 | 12.29 | 9.55 | 9.55 | 9.55 | 9.55 | 9.55 |
| Accounts Payable | 7,291.6 | 7,138.9 | 7,882.4 | 9,786.7 | 14,066.1 | 14,398.2 | 16,816.8 | 19,641.6 | 22,941.0 | 26,794.5 |
| Accounts Payable, % | 47.38 | 39.59 | 38.99 | 40.36 | 49.18 | 43.1 | 43.1 | 43.1 | 43.1 | 43.1 |
| Capital Expenditure | -365.0 | -262.3 | -276.2 | -274.0 | -324.9 | -498.3 | -582.0 | -679.8 | -794.0 | -927.4 |
| Capital Expenditure, % | -2.37 | -1.45 | -1.37 | -1.13 | -1.14 | -1.49 | -1.49 | -1.49 | -1.49 | -1.49 |
| Tax Rate, % | 14.05 | 14.05 | 14.05 | 14.05 | 14.05 | 14.05 | 14.05 | 14.05 | 14.05 | 14.05 |
| EBITAT | 17.2 | 150.7 | 270.5 | 738.5 | 717.4 | 531.4 | 620.7 | 724.9 | 846.7 | 988.9 |
| Depreciation | ||||||||||
| Changes in Account Receivables | ||||||||||
| Changes in Inventories | ||||||||||
| Changes in Accounts Payable | ||||||||||
| Capital Expenditure | ||||||||||
| UFCF | 2,156.2 | 652.3 | 1,266.3 | 1,912.2 | 3,700.0 | -755.9 | 1,771.6 | 2,069.2 | 2,416.8 | 2,822.7 |
| WACC, % | 6.04 | 6.06 | 6.01 | 6.04 | 6.02 | 6.03 | 6.03 | 6.03 | 6.03 | 6.03 |
| PV UFCF | ||||||||||
| SUM PV UFCF | 6,616.4 | |||||||||
| Long Term Growth Rate, % | 3.50 | |||||||||
| Free cash flow (T + 1) | 2,922 | |||||||||
| Terminal Value | 115,322 | |||||||||
| Present Terminal Value | 86,040 | |||||||||
| Enterprise Value | 92,656 | |||||||||
| Net Debt | -9,624 | |||||||||
| Equity Value | 102,280 | |||||||||
| Diluted Shares Outstanding, MM | 1,030 | |||||||||
| Equity Value Per Share | 99.32 |
What You Will Receive
- Genuine Changhong Meiling Data: Comprehensive financials – from revenue to EBIT – derived from real and projected statistics.
- Complete Customization: Modify all key parameters (yellow cells) such as WACC, growth %, and tax rates to fit your analysis.
- Immediate Valuation Adjustments: Automatic recalculations enable you to assess the effects of changes on Changhong Meiling’s fair value.
- Flexible Excel Template: Designed for quick modifications, scenario analysis, and in-depth forecasting.
- Efficient and Precise: Eliminate the need to construct models from the ground up while ensuring accuracy and adaptability.
Key Features
- Customizable Forecast Inputs: Adjust essential metrics such as revenue growth, EBITDA percentage, and capital expenditures.
- Instant DCF Valuation: Provides immediate calculations of intrinsic value, NPV, and other financial metrics.
- High-Precision Accuracy: Leverages Changhong Meiling’s actual financial data for credible valuation results.
- Streamlined Scenario Analysis: Effortlessly explore different assumptions and assess their impacts.
- Efficiency-Enhancing Solution: Remove the complexity of building valuation models from the ground up.
How It Operates
- Download the Template: Gain immediate access to the Excel-based Changhong Meiling DCF Calculator.
- Input Your Assumptions: Modify the yellow-highlighted cells for growth rates, WACC, margins, and other parameters.
- Instant Calculations: The model automatically recalculates the intrinsic value of Changhong Meiling.
- Test Scenarios: Experiment with various assumptions to assess potential changes in valuation.
- Analyze and Decide: Leverage the results to inform your investment or financial decisions.
Why Opt for This Calculator for Changhong Meiling Co., Ltd. (000521SZ)?
- Reliable Data: Utilize authentic financial information from Changhong Meiling for trustworthy valuation insights.
- Flexible Customization: Modify essential variables such as growth rates, WACC, and tax rates to align with your forecasts.
- Efficiency: Pre-configured calculations save you the hassle of building models from the ground up.
- Professional Quality: Tailored for investors, analysts, and consultants in the field.
- User-Friendly Interface: Designed with an intuitive layout and step-by-step guidance for users of all skill levels.
Who Can Benefit from Changhong Meiling Co., Ltd. (000521SZ) Products?
- Investors: Make informed choices with our advanced valuation tools tailored for precision.
- Financial Analysts: Streamline your workflow with our customizable DCF models designed for efficiency.
- Consultants: Effortlessly modify templates for impactful client presentations or detailed reports.
- Finance Enthusiasts: Enhance your knowledge of valuation methods with practical, real-life examples.
- Educators and Students: Leverage our resources as effective learning aids in finance-focused curricula.
Contents of the Template
- Comprehensive DCF Model: Editable template featuring intricate valuation calculations.
- Real-World Data: Changhong Meiling Co., Ltd.'s (000521SZ) historical and projected financials preloaded for in-depth analysis.
- Customizable Parameters: Modify WACC, growth rates, and tax assumptions to explore various scenarios.
- Financial Statements: Complete annual and quarterly breakdowns for enhanced insight.
- Key Ratios: Integrated analysis covering profitability, efficiency, and leverage metrics.
- Dashboard with Visual Outputs: Charts and tables providing clear and actionable results.
Disclaimer
All information, articles, and product details provided on this website are for general informational and educational purposes only. We do not claim any ownership over, nor do we intend to infringe upon, any trademarks, copyrights, logos, brand names, or other intellectual property mentioned or depicted on this site. Such intellectual property remains the property of its respective owners, and any references here are made solely for identification or informational purposes, without implying any affiliation, endorsement, or partnership.
We make no representations or warranties, express or implied, regarding the accuracy, completeness, or suitability of any content or products presented. Nothing on this website should be construed as legal, tax, investment, financial, medical, or other professional advice. In addition, no part of this site—including articles or product references—constitutes a solicitation, recommendation, endorsement, advertisement, or offer to buy or sell any securities, franchises, or other financial instruments, particularly in jurisdictions where such activity would be unlawful.
All content is of a general nature and may not address the specific circumstances of any individual or entity. It is not a substitute for professional advice or services. Any actions you take based on the information provided here are strictly at your own risk. You accept full responsibility for any decisions or outcomes arising from your use of this website and agree to release us from any liability in connection with your use of, or reliance upon, the content or products found herein.