
|
CPT Technology Co.، Ltd (000536.SZ) تقييم DCF |
Fully Editable: Tailor To Your Needs In Excel Or Sheets
Professional Design: Trusted, Industry-Standard Templates
Investor-Approved Valuation Models
MAC/PC Compatible, Fully Unlocked
No Expertise Is Needed; Easy To Follow
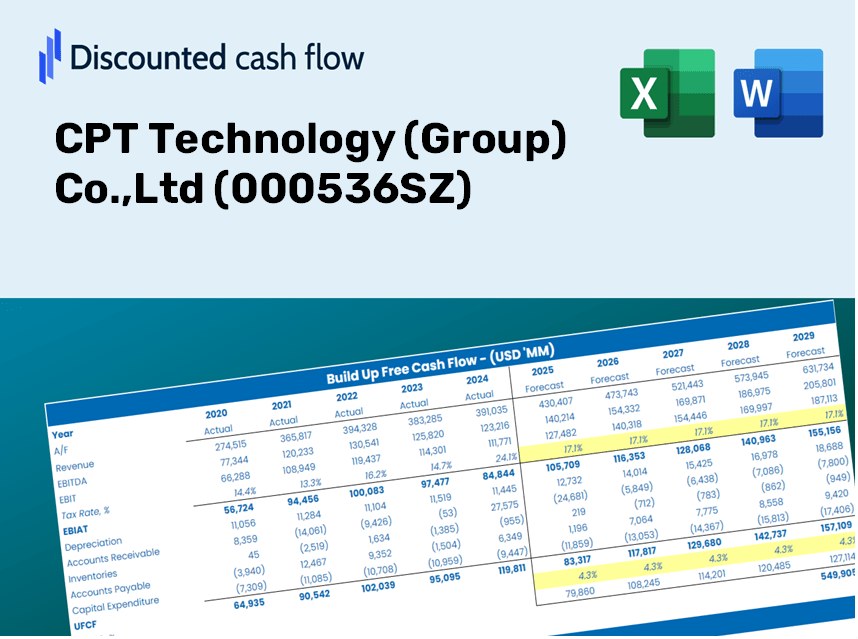
CPT Technology (Group) Co.,Ltd (000536.SZ) Bundle
Enhance your investment strategies with the CPT Technology (Group) Co., Ltd DCF Calculator! Review genuine CPT Technology (Group) Co.,Ltd financial data, adjust growth projections and expenses, and instantly observe how these modifications affect the intrinsic value of CPT Technology (Group) Co., Ltd.
Discounted Cash Flow (DCF) - (USD MM)
| Year | AY1 2020 |
AY2 2021 |
AY3 2022 |
AY4 2023 |
AY5 2024 |
FY1 2025 |
FY2 2026 |
FY3 2027 |
FY4 2028 |
FY5 2029 |
|---|---|---|---|---|---|---|---|---|---|---|
| Revenue | 2,193.9 | 3,013.7 | 2,349.8 | 1,455.4 | 1,739.0 | 1,724.9 | 1,710.9 | 1,697.1 | 1,683.3 | 1,669.7 |
| Revenue Growth, % | 0 | 37.37 | -22.03 | -38.06 | 19.48 | -0.81005 | -0.81005 | -0.81005 | -0.81005 | -0.81005 |
| EBITDA | 121.0 | 639.2 | -313.9 | -477.1 | -46.3 | -76.1 | -75.5 | -74.9 | -74.3 | -73.7 |
| EBITDA, % | 5.51 | 21.21 | -13.36 | -32.78 | -2.66 | -4.41 | -4.41 | -4.41 | -4.41 | -4.41 |
| Depreciation | 921.4 | 868.7 | 843.4 | 821.5 | 802.6 | 722.1 | 716.2 | 710.4 | 704.7 | 699.0 |
| Depreciation, % | 42 | 28.82 | 35.89 | 56.44 | 46.15 | 41.86 | 41.86 | 41.86 | 41.86 | 41.86 |
| EBIT | -800.4 | -229.4 | -1,157.3 | -1,298.6 | -848.9 | -798.2 | -791.8 | -785.3 | -779.0 | -772.7 |
| EBIT, % | -36.48 | -7.61 | -49.25 | -89.22 | -48.81 | -46.28 | -46.28 | -46.28 | -46.28 | -46.28 |
| Total Cash | 1,617.9 | 1,558.1 | 2,333.5 | 1,060.5 | 500.3 | 1,125.9 | 1,116.8 | 1,107.8 | 1,098.8 | 1,089.9 |
| Total Cash, percent | .0 | .0 | .0 | .0 | .0 | .0 | .0 | .0 | .0 | .0 |
| Account Receivables | 271.6 | 387.6 | 135.4 | 136.7 | 142.1 | 167.5 | 166.2 | 164.8 | 163.5 | 162.2 |
| Account Receivables, % | 12.38 | 12.86 | 5.76 | 9.39 | 8.17 | 9.71 | 9.71 | 9.71 | 9.71 | 9.71 |
| Inventories | 535.2 | 661.4 | 192.2 | 215.0 | 202.5 | 279.2 | 277.0 | 274.7 | 272.5 | 270.3 |
| Inventories, % | 24.4 | 21.95 | 8.18 | 14.77 | 11.64 | 16.19 | 16.19 | 16.19 | 16.19 | 16.19 |
| Accounts Payable | 457.4 | 459.6 | 34.2 | 511.9 | 685.3 | 386.8 | 383.7 | 380.6 | 377.5 | 374.4 |
| Accounts Payable, % | 20.85 | 15.25 | 1.45 | 35.17 | 39.41 | 22.43 | 22.43 | 22.43 | 22.43 | 22.43 |
| Capital Expenditure | -765.6 | -390.5 | -271.6 | -131.3 | -92.6 | -254.5 | -252.4 | -250.3 | -248.3 | -246.3 |
| Capital Expenditure, % | -34.9 | -12.96 | -11.56 | -9.02 | -5.33 | -14.75 | -14.75 | -14.75 | -14.75 | -14.75 |
| Tax Rate, % | 0.1202 | 0.1202 | 0.1202 | 0.1202 | 0.1202 | 0.1202 | 0.1202 | 0.1202 | 0.1202 | 0.1202 |
| EBITAT | -794.8 | -267.8 | -1,159.3 | -1,296.3 | -847.8 | -796.6 | -790.2 | -783.8 | -777.4 | -771.1 |
| Depreciation | ||||||||||
| Changes in Account Receivables | ||||||||||
| Changes in Inventories | ||||||||||
| Changes in Accounts Payable | ||||||||||
| Capital Expenditure | ||||||||||
| UFCF | -988.4 | -29.7 | -291.6 | -152.4 | 42.6 | -729.6 | -325.9 | -323.2 | -320.6 | -318.0 |
| WACC, % | 5.93 | 5.94 | 5.94 | 5.94 | 5.94 | 5.94 | 5.94 | 5.94 | 5.94 | 5.94 |
| PV UFCF | ||||||||||
| SUM PV UFCF | -1,743.8 | |||||||||
| Long Term Growth Rate, % | 2.00 | |||||||||
| Free cash flow (T + 1) | -324 | |||||||||
| Terminal Value | -8,237 | |||||||||
| Present Terminal Value | -6,174 | |||||||||
| Enterprise Value | -7,917 | |||||||||
| Net Debt | 1,064 | |||||||||
| Equity Value | -8,981 | |||||||||
| Diluted Shares Outstanding, MM | 2,766 | |||||||||
| Equity Value Per Share | -3.25 |
Benefits You Will Receive
- Authentic CPT Financial Data: Pre-populated with CPT Technology’s historical and projected figures for accurate assessments.
- Completely Customizable Template: Easily adjust essential inputs such as revenue growth, WACC, and EBITDA percentage.
- Real-Time Calculations: Instantly observe updates in CPT’s intrinsic value as you make modifications.
- Expert Valuation Tool: Tailored for investors, analysts, and consultants in need of reliable DCF results.
- Intuitive Layout: Streamlined structure and straightforward guidelines suitable for users of all skill levels.
Key Features
- Pre-Loaded Data: CPT Technology's historical financial statements and pre-filled forecasts.
- Fully Adjustable Inputs: Customize WACC, tax rates, revenue growth, and EBITDA margins.
- Instant Results: Watch CPT Technology’s intrinsic value update in real time.
- Clear Visual Outputs: Dashboard charts illustrate valuation results and essential metrics.
- Built for Accuracy: A professional-grade tool designed for analysts, investors, and finance professionals.
How It Functions
- Step 1: Download the prebuilt Excel template featuring CPT Technology's (000536SZ) data.
- Step 2: Review the pre-filled sheets to familiarize yourself with the essential metrics.
- Step 3: Modify forecasts and assumptions in the editable yellow cells (WACC, growth, margins).
- Step 4: Instantly observe recalibrated results, including the intrinsic value of CPT Technology (000536SZ).
- Step 5: Make well-informed investment choices or prepare reports based on the generated outputs.
Why Opt for This Calculator?
- User-Friendly: Tailored for both novices and seasoned users.
- Adjustable Parameters: Easily customize inputs to suit your analysis.
- Real-Time Feedback: Instantly view changes in CPT Technology's valuation as you tweak inputs.
- Preconfigured: Comes with CPT Technology’s actual financial data for immediate evaluation.
- Approved by Experts: Utilized by investors and analysts for informed decision-making.
Who Can Benefit from CPT Technology (Group) Co.,Ltd (000536SZ)?
- Finance Students: Master financial modeling techniques and apply them to real-world scenarios.
- Academics: Integrate advanced valuation models into your teaching or research projects.
- Investors: Validate your investment hypotheses and evaluate the valuation metrics of CPT Technology (Group) Co.,Ltd (000536SZ).
- Analysts: Enhance your analysis process with a customizable DCF model tailored for CPT Technology (Group) Co.,Ltd (000536SZ).
- Small Business Owners: Understand the evaluation methods used for large public firms like CPT Technology (Group) Co.,Ltd (000536SZ).
Contents of the Template
- Pre-Filled DCF Model: CPT Technology’s financial data preloaded for immediate application.
- WACC Calculator: Comprehensive calculations for Weighted Average Cost of Capital.
- Financial Ratios: Assess CPT Technology's profitability, leverage, and operational efficiency.
- Editable Inputs: Modify assumptions such as growth rates, profit margins, and CAPEX to suit your analysis.
- Financial Statements: Access annual and quarterly reports for thorough examination.
- Interactive Dashboard: Effortlessly visualize essential valuation metrics and outcomes.
Disclaimer
All information, articles, and product details provided on this website are for general informational and educational purposes only. We do not claim any ownership over, nor do we intend to infringe upon, any trademarks, copyrights, logos, brand names, or other intellectual property mentioned or depicted on this site. Such intellectual property remains the property of its respective owners, and any references here are made solely for identification or informational purposes, without implying any affiliation, endorsement, or partnership.
We make no representations or warranties, express or implied, regarding the accuracy, completeness, or suitability of any content or products presented. Nothing on this website should be construed as legal, tax, investment, financial, medical, or other professional advice. In addition, no part of this site—including articles or product references—constitutes a solicitation, recommendation, endorsement, advertisement, or offer to buy or sell any securities, franchises, or other financial instruments, particularly in jurisdictions where such activity would be unlawful.
All content is of a general nature and may not address the specific circumstances of any individual or entity. It is not a substitute for professional advice or services. Any actions you take based on the information provided here are strictly at your own risk. You accept full responsibility for any decisions or outcomes arising from your use of this website and agree to release us from any liability in connection with your use of, or reliance upon, the content or products found herein.