
|
شركة Jilin Aodong Pharmaceutical Group Co.، Ltd. (000623.SZ) تقييم DCF |
Fully Editable: Tailor To Your Needs In Excel Or Sheets
Professional Design: Trusted, Industry-Standard Templates
Investor-Approved Valuation Models
MAC/PC Compatible, Fully Unlocked
No Expertise Is Needed; Easy To Follow
Jilin Aodong Pharmaceutical Group Co., Ltd. (000623.SZ) Bundle
Explore the financial potential of Jilin Aodong Pharmaceutical Group Co., Ltd. (000623SZ) with our user-friendly DCF Calculator! Simply enter your assumptions regarding growth, margins, and costs to calculate the intrinsic value of Jilin Aodong Pharmaceutical Group Co., Ltd. (000623SZ) and enhance your investment strategy.
Discounted Cash Flow (DCF) - (USD MM)
| Year | AY1 2020 |
AY2 2021 |
AY3 2022 |
AY4 2023 |
AY5 2024 |
FY1 2025 |
FY2 2026 |
FY3 2027 |
FY4 2028 |
FY5 2029 |
|---|---|---|---|---|---|---|---|---|---|---|
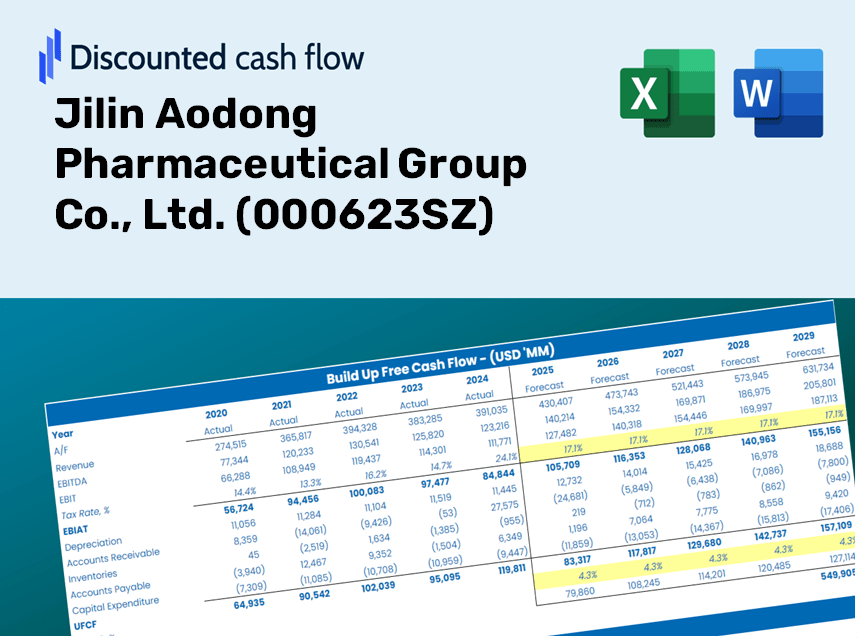
| Revenue | 2,251.7 | 2,303.8 | 2,868.2 | 3,449.1 | 2,610.6 | 2,759.1 | 2,916.1 | 3,082.0 | 3,257.3 | 3,442.6 |
| Revenue Growth, % | 0 | 2.31 | 24.5 | 20.25 | -24.31 | 5.69 | 5.69 | 5.69 | 5.69 | 5.69 |
| EBITDA | 129.7 | 200.4 | 326.5 | 339.8 | 45.5 | 206.6 | 218.3 | 230.8 | 243.9 | 257.8 |
| EBITDA, % | 5.76 | 8.7 | 11.38 | 9.85 | 1.74 | 7.49 | 7.49 | 7.49 | 7.49 | 7.49 |
| Depreciation | 195.5 | 194.5 | 196.6 | 205.3 | 205.9 | 208.7 | 220.6 | 233.1 | 246.4 | 260.4 |
| Depreciation, % | 8.68 | 8.44 | 6.85 | 5.95 | 7.89 | 7.56 | 7.56 | 7.56 | 7.56 | 7.56 |
| EBIT | -65.7 | 5.9 | 129.9 | 134.5 | -160.4 | -2.1 | -2.2 | -2.3 | -2.5 | -2.6 |
| EBIT, % | -2.92 | 0.25472 | 4.53 | 3.9 | -6.14 | -0.07591055 | -0.07591055 | -0.07591055 | -0.07591055 | -0.07591055 |
| Total Cash | 3,804.0 | 3,931.4 | 3,078.2 | 3,378.3 | 2,675.1 | 2,747.8 | 2,904.1 | 3,069.3 | 3,243.9 | 3,428.5 |
| Total Cash, percent | .0 | .0 | .0 | .0 | .0 | .0 | .0 | .0 | .0 | .0 |
| Account Receivables | 1,078.2 | 1,032.8 | 1,116.5 | 1,445.1 | 1,180.5 | 1,207.2 | 1,275.9 | 1,348.4 | 1,425.2 | 1,506.2 |
| Account Receivables, % | 47.88 | 44.83 | 38.93 | 41.9 | 45.22 | 43.75 | 43.75 | 43.75 | 43.75 | 43.75 |
| Inventories | 548.5 | 591.9 | 874.6 | 872.3 | 936.9 | 782.0 | 826.5 | 873.6 | 923.3 | 975.8 |
| Inventories, % | 24.36 | 25.69 | 30.49 | 25.29 | 35.89 | 28.34 | 28.34 | 28.34 | 28.34 | 28.34 |
| Accounts Payable | 262.6 | 238.2 | 451.0 | 418.6 | 425.7 | 365.1 | 385.9 | 407.9 | 431.1 | 455.6 |
| Accounts Payable, % | 11.66 | 10.34 | 15.72 | 12.14 | 16.31 | 13.23 | 13.23 | 13.23 | 13.23 | 13.23 |
| Capital Expenditure | -227.4 | -313.3 | -271.0 | -419.5 | -274.0 | -307.9 | -325.5 | -344.0 | -363.5 | -384.2 |
| Capital Expenditure, % | -10.1 | -13.6 | -9.45 | -12.16 | -10.5 | -11.16 | -11.16 | -11.16 | -11.16 | -11.16 |
| Tax Rate, % | -1.97 | -1.97 | -1.97 | -1.97 | -1.97 | -1.97 | -1.97 | -1.97 | -1.97 | -1.97 |
| EBITAT | -65.4 | 5.9 | 134.4 | 130.9 | -163.6 | -2.1 | -2.2 | -2.3 | -2.5 | -2.6 |
| Depreciation | ||||||||||
| Changes in Account Receivables | ||||||||||
| Changes in Inventories | ||||||||||
| Changes in Accounts Payable | ||||||||||
| Capital Expenditure | ||||||||||
| UFCF | -1,461.4 | -135.3 | -93.5 | -442.1 | -24.5 | -33.7 | -199.5 | -210.8 | -222.8 | -235.5 |
| WACC, % | 5.98 | 5.98 | 5.98 | 5.97 | 5.98 | 5.98 | 5.98 | 5.98 | 5.98 | 5.98 |
| PV UFCF | ||||||||||
| SUM PV UFCF | -739.4 | |||||||||
| Long Term Growth Rate, % | 3.50 | |||||||||
| Free cash flow (T + 1) | -244 | |||||||||
| Terminal Value | -9,836 | |||||||||
| Present Terminal Value | -7,357 | |||||||||
| Enterprise Value | -8,097 | |||||||||
| Net Debt | 1,160 | |||||||||
| Equity Value | -9,256 | |||||||||
| Diluted Shares Outstanding, MM | 1,177 | |||||||||
| Equity Value Per Share | -7.86 |
Benefits You Will Receive
- Pre-Loaded Financial Model: Utilize Jilin Aodong Pharmaceutical Group's actual data for accurate DCF valuation.
- Comprehensive Forecast Control: Modify revenue growth, profit margins, WACC, and other essential factors.
- Real-Time Calculations: Automatic updates let you view results immediately as adjustments are made.
- Professional-Grade Template: A polished Excel file crafted for high-level valuation purposes.
- Flexible and Reusable: Designed for adaptability, enabling repeated application for in-depth forecasts.
Key Features
- Authentic Financial Data for Jilin Aodong: Gain access to reliable historical financial records and future forecasts.
- Adjustable Forecast Parameters: Modify highlighted cells for key metrics like WACC, growth rates, and profit margins.
- Real-Time Calculations: Automatic updates for DCF, Net Present Value (NPV), and cash flow evaluations.
- User-Friendly Dashboard: Clear charts and summaries to help visualize your valuation outcomes.
- Suitable for All Skill Levels: A straightforward, intuitive layout designed for investors, CFOs, and consultants alike.
How It Functions
- Download the Template: Gain immediate access to the Excel-based Jilin Aodong Pharmaceutical DCF Calculator.
- Input Your Assumptions: Modify the yellow-highlighted cells to reflect growth rates, WACC, profit margins, and more.
- Instant Calculations: The model promptly calculates the intrinsic value of Jilin Aodong Pharmaceutical.
- Test Scenarios: Experiment with various assumptions to assess potential changes in valuation.
- Analyze and Decide: Utilize the outcomes to inform your investment decisions or financial analysis.
Why Opt for Jilin Aodong Pharmaceutical’s Calculator?
- Time-Saving: Skip the hassle of building a DCF model from the ground up – it’s pre-configured for your convenience.
- Enhanced Precision: Dependable financial metrics and calculations minimize valuation discrepancies.
- Fully Adaptable: Modify the model to align with your specific assumptions and forecasts.
- Simplified Analysis: Intuitive charts and outputs facilitate effortless interpretation of results.
- Endorsed by Professionals: Crafted for experts who prioritize accuracy and user-friendliness.
Who Can Benefit from This Product?
- Individual Investors: Make informed choices regarding the purchase or sale of Jilin Aodong Pharmaceutical Group Co., Ltd. (000623SZ) stock.
- Financial Analysts: Enhance valuation processes with readily available financial models tailored for Jilin Aodong Pharmaceutical Group Co., Ltd. (000623SZ).
- Consultants: Provide clients with accurate and timely valuation insights related to Jilin Aodong Pharmaceutical Group Co., Ltd. (000623SZ).
- Business Owners: Gain understanding of how large pharmaceutical companies like Jilin Aodong Pharmaceutical Group Co., Ltd. (000623SZ) are valued to inform your own business strategies.
- Finance Students: Master valuation methods using real-world examples and data from Jilin Aodong Pharmaceutical Group Co., Ltd. (000623SZ).
Contents of the Template
- Pre-Filled Data: Contains Jilin Aodong Pharmaceutical Group Co., Ltd.'s historical financials and projections.
- Discounted Cash Flow Model: Editable DCF valuation model featuring automatic calculations.
- Weighted Average Cost of Capital (WACC): A dedicated sheet for WACC calculations based on custom inputs.
- Key Financial Ratios: Evaluate Jilin Aodong's profitability, efficiency, and leverage metrics.
- Customizable Inputs: Easily modify revenue growth, margins, and tax rates.
- Clear Dashboard: Visuals and tables that summarize key valuation outcomes.
Disclaimer
All information, articles, and product details provided on this website are for general informational and educational purposes only. We do not claim any ownership over, nor do we intend to infringe upon, any trademarks, copyrights, logos, brand names, or other intellectual property mentioned or depicted on this site. Such intellectual property remains the property of its respective owners, and any references here are made solely for identification or informational purposes, without implying any affiliation, endorsement, or partnership.
We make no representations or warranties, express or implied, regarding the accuracy, completeness, or suitability of any content or products presented. Nothing on this website should be construed as legal, tax, investment, financial, medical, or other professional advice. In addition, no part of this site—including articles or product references—constitutes a solicitation, recommendation, endorsement, advertisement, or offer to buy or sell any securities, franchises, or other financial instruments, particularly in jurisdictions where such activity would be unlawful.
All content is of a general nature and may not address the specific circumstances of any individual or entity. It is not a substitute for professional advice or services. Any actions you take based on the information provided here are strictly at your own risk. You accept full responsibility for any decisions or outcomes arising from your use of this website and agree to release us from any liability in connection with your use of, or reliance upon, the content or products found herein.