
|
شركة Infotmic Co.، Ltd. (000670.SZ) تقييم DCF |
Fully Editable: Tailor To Your Needs In Excel Or Sheets
Professional Design: Trusted, Industry-Standard Templates
Investor-Approved Valuation Models
MAC/PC Compatible, Fully Unlocked
No Expertise Is Needed; Easy To Follow
Infotmic Co., Ltd. (000670.SZ) Bundle
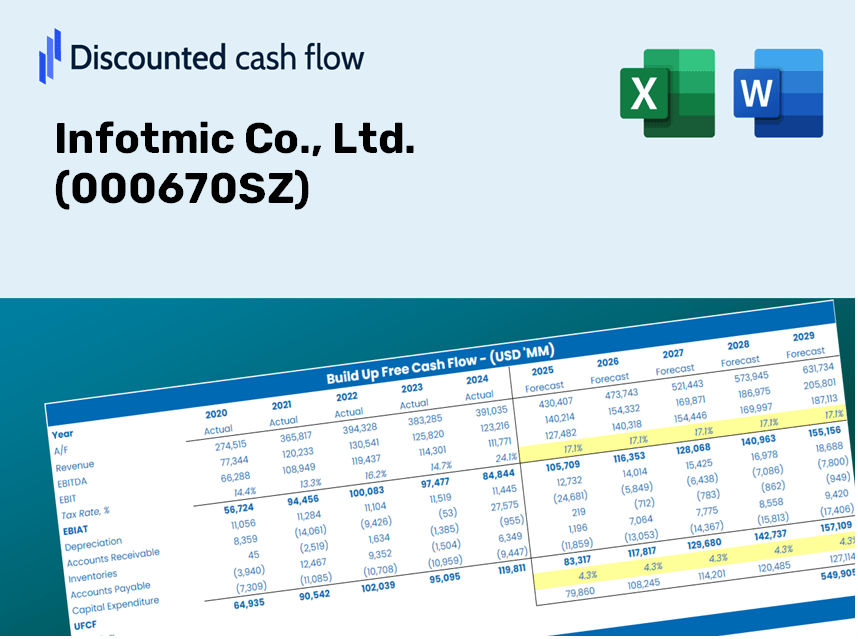
Whether you’re an investor or analyst, this (000670SZ) DCF Calculator is your go-to tool for accurate valuation. Preloaded with Infotmic Co., Ltd. real data, you can adjust forecasts and observe the effects in real time.
Discounted Cash Flow (DCF) - (USD MM)
| Year | AY1 2020 |
AY2 2021 |
AY3 2022 |
AY4 2023 |
AY5 2024 |
FY1 2025 |
FY2 2026 |
FY3 2027 |
FY4 2028 |
FY5 2029 |
|---|---|---|---|---|---|---|---|---|---|---|
| Revenue | 700.0 | 2,890.0 | 3,124.2 | 3,466.9 | 4,081.3 | 5,477.1 | 7,350.1 | 9,863.8 | 13,237.0 | 17,763.9 |
| Revenue Growth, % | 0 | 312.88 | 8.1 | 10.97 | 17.72 | 34.2 | 34.2 | 34.2 | 34.2 | 34.2 |
| EBITDA | 31.3 | 110.3 | 93.0 | 41.8 | 60.0 | 152.7 | 205.0 | 275.1 | 369.2 | 495.4 |
| EBITDA, % | 4.48 | 3.82 | 2.98 | 1.2 | 1.47 | 2.79 | 2.79 | 2.79 | 2.79 | 2.79 |
| Depreciation | .6 | .8 | 1.3 | 2.7 | 2.5 | 3.2 | 4.3 | 5.7 | 7.7 | 10.3 |
| Depreciation, % | 0.08119007 | 0.02922768 | 0.04278283 | 0.0765324 | 0.06150388 | 0.05824737 | 0.05824737 | 0.05824737 | 0.05824737 | 0.05824737 |
| EBIT | 30.8 | 109.5 | 91.7 | 39.1 | 57.5 | 149.6 | 200.7 | 269.3 | 361.4 | 485.0 |
| EBIT, % | 4.4 | 3.79 | 2.93 | 1.13 | 1.41 | 2.73 | 2.73 | 2.73 | 2.73 | 2.73 |
| Total Cash | 318.5 | 20.1 | 43.6 | 16.6 | 30.6 | 534.9 | 717.8 | 963.3 | 1,292.7 | 1,734.8 |
| Total Cash, percent | .0 | .0 | .0 | .0 | .0 | .0 | .0 | .0 | .0 | .0 |
| Account Receivables | 567.5 | 773.7 | 1,227.2 | 1,083.9 | 1,104.2 | 2,250.5 | 3,020.1 | 4,052.9 | 5,439.0 | 7,299.0 |
| Account Receivables, % | 81.07 | 26.77 | 39.28 | 31.27 | 27.06 | 41.09 | 41.09 | 41.09 | 41.09 | 41.09 |
| Inventories | 87.5 | 228.1 | 208.1 | 395.6 | 170.5 | 467.1 | 626.9 | 841.3 | 1,129.0 | 1,515.0 |
| Inventories, % | 12.5 | 7.89 | 6.66 | 11.41 | 4.18 | 8.53 | 8.53 | 8.53 | 8.53 | 8.53 |
| Accounts Payable | 140.9 | 291.2 | 519.7 | 389.1 | 294.2 | 715.0 | 959.6 | 1,287.7 | 1,728.1 | 2,319.1 |
| Accounts Payable, % | 20.14 | 10.08 | 16.63 | 11.22 | 7.21 | 13.06 | 13.06 | 13.06 | 13.06 | 13.06 |
| Capital Expenditure | -.2 | -2.7 | -.4 | -6.5 | -2.2 | -4.2 | -5.6 | -7.5 | -10.1 | -13.5 |
| Capital Expenditure, % | -0.03199464 | -0.09424039 | -0.01314491 | -0.18822 | -0.05349032 | -0.07621736 | -0.07621736 | -0.07621736 | -0.07621736 | -0.07621736 |
| Tax Rate, % | -779.61 | -779.61 | -779.61 | -779.61 | -779.61 | -779.61 | -779.61 | -779.61 | -779.61 | -779.61 |
| EBITAT | 9.6 | 4.2 | 14.6 | 114.1 | 505.7 | 75.0 | 100.7 | 135.1 | 181.4 | 243.4 |
| Depreciation | ||||||||||
| Changes in Account Receivables | ||||||||||
| Changes in Inventories | ||||||||||
| Changes in Accounts Payable | ||||||||||
| Capital Expenditure | ||||||||||
| UFCF | -504.1 | -194.3 | -189.5 | -64.5 | 615.9 | -948.0 | -585.5 | -785.7 | -1,054.4 | -1,415.0 |
| WACC, % | 5.65 | 5.47 | 5.55 | 6.11 | 6.11 | 5.78 | 5.78 | 5.78 | 5.78 | 5.78 |
| PV UFCF | ||||||||||
| SUM PV UFCF | -3,993.9 | |||||||||
| Long Term Growth Rate, % | 3.00 | |||||||||
| Free cash flow (T + 1) | -1,457 | |||||||||
| Terminal Value | -52,457 | |||||||||
| Present Terminal Value | -39,612 | |||||||||
| Enterprise Value | -43,606 | |||||||||
| Net Debt | 380 | |||||||||
| Equity Value | -43,985 | |||||||||
| Diluted Shares Outstanding, MM | 816 | |||||||||
| Equity Value Per Share | -53.87 |
What You Will Receive
- Customizable Excel Template: An entirely adaptable Excel-based DCF Calculator featuring pre-filled financial data for Infotmic Co., Ltd. (000670SZ).
- Actual Data Insights: Access to historical data and projected estimates (highlighted in yellow cells).
- Flexible Forecasting: Adjust forecast variables such as revenue growth, EBITDA %, and WACC as needed.
- Instant Calculations: Quickly evaluate how your inputs influence Infotmic's valuation.
- Professional-Grade Tool: Designed for investors, CFOs, consultants, and financial analysts.
- User-Friendly Interface: Organized for simplicity and clarity, complete with step-by-step guidance.
Key Features
- Accurate Historical Data: Gain access to reliable pre-loaded historical financial data and future forecasts for Infotmic Co., Ltd. (000670SZ).
- Adjustable Forecast Parameters: Customize crucial inputs such as WACC, growth rates, and margins in the highlighted cells.
- Automated Financial Calculations: Enjoy real-time updates to DCF, Net Present Value (NPV), and cash flow analysis.
- User-Friendly Dashboard: View clear and informative charts and summaries to help you understand your valuation results.
- Designed for All Skill Levels: An intuitive layout tailored for investors, CFOs, and consultants, perfect for both novices and seasoned professionals.
How It Works
- Step 1: Download the prebuilt Excel template containing Infotmic Co., Ltd. (000670SZ) data.
- Step 2: Navigate through the pre-filled sheets to grasp the essential metrics.
- Step 3: Modify forecasts and assumptions in the editable yellow cells (WACC, growth, margins).
- Step 4: Immediately see the updated results, which include Infotmic Co., Ltd. (000670SZ)'s intrinsic value.
- Step 5: Utilize the outputs to make informed investment decisions or create comprehensive reports.
Why Opt for the Infotmic Calculator?
- Precision: Leverages authentic Infotmic financial data for reliable results.
- Adaptability: Crafted to empower users to experiment with and adjust their inputs at will.
- Efficiency: Eliminate the need to construct a DCF model from the ground up.
- Executive-Quality: Engineered with the expertise and usability that meet CFO standards.
- Accessible: Intuitive interface suitable for users of all financial modeling backgrounds.
Who Should Use This Product?
- Investors: Effectively assess the fair value of Infotmic Co., Ltd. (000670SZ) prior to making investment choices.
- CFOs: Utilize a high-quality DCF model for comprehensive financial reporting and analysis.
- Consultants: Easily customize the template for client valuation reports.
- Entrepreneurs: Discover financial modeling strategies employed by leading companies.
- Educators: Implement it as a resource to teach valuation techniques and methodologies.
Contents of the Template
- Pre-Filled Data: Features Infotmic Co., Ltd.'s historical financial performance and projections.
- Discounted Cash Flow Model: An editable DCF valuation model with built-in calculations.
- Weighted Average Cost of Capital (WACC): A dedicated sheet for computing WACC using customized inputs.
- Key Financial Ratios: Evaluate Infotmic Co., Ltd.'s profitability, efficiency, and financial leverage.
- Customizable Inputs: Easily modify revenue growth, margins, and tax rates.
- Clear Dashboard: Visual representations and tables highlighting essential valuation outcomes.
Disclaimer
All information, articles, and product details provided on this website are for general informational and educational purposes only. We do not claim any ownership over, nor do we intend to infringe upon, any trademarks, copyrights, logos, brand names, or other intellectual property mentioned or depicted on this site. Such intellectual property remains the property of its respective owners, and any references here are made solely for identification or informational purposes, without implying any affiliation, endorsement, or partnership.
We make no representations or warranties, express or implied, regarding the accuracy, completeness, or suitability of any content or products presented. Nothing on this website should be construed as legal, tax, investment, financial, medical, or other professional advice. In addition, no part of this site—including articles or product references—constitutes a solicitation, recommendation, endorsement, advertisement, or offer to buy or sell any securities, franchises, or other financial instruments, particularly in jurisdictions where such activity would be unlawful.
All content is of a general nature and may not address the specific circumstances of any individual or entity. It is not a substitute for professional advice or services. Any actions you take based on the information provided here are strictly at your own risk. You accept full responsibility for any decisions or outcomes arising from your use of this website and agree to release us from any liability in connection with your use of, or reliance upon, the content or products found herein.