
|
شركة Shanxi Meijin Energy Co.، Ltd. (000723.SZ) تقييم DCF |
Fully Editable: Tailor To Your Needs In Excel Or Sheets
Professional Design: Trusted, Industry-Standard Templates
Investor-Approved Valuation Models
MAC/PC Compatible, Fully Unlocked
No Expertise Is Needed; Easy To Follow
Shanxi Meijin Energy Co.,Ltd. (000723.SZ) Bundle
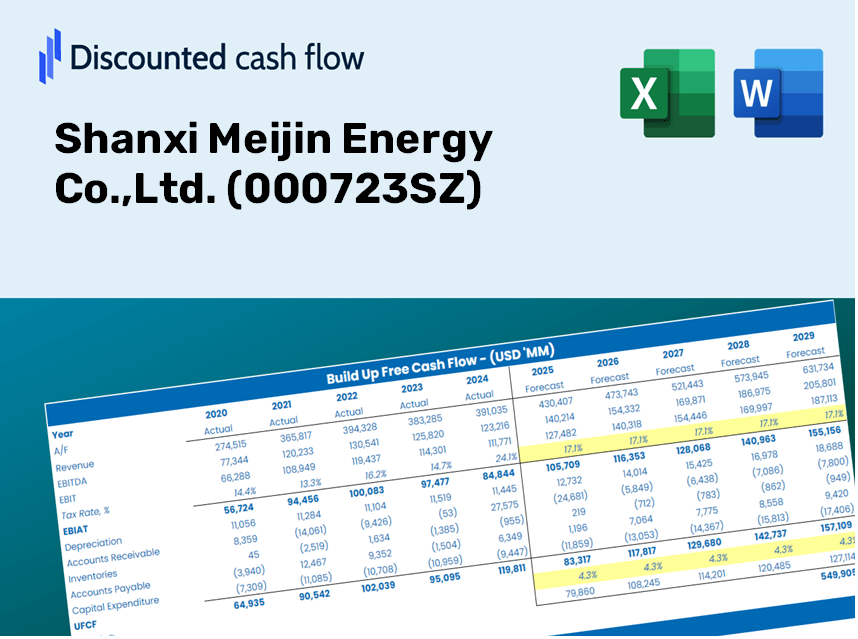
Simplify Shanxi Meijin Energy Co., Ltd. valuation with this customizable DCF Calculator! Featuring real Shanxi Meijin Energy Co., Ltd. financials and adjustable forecast inputs, you can test scenarios and uncover Shanxi Meijin Energy Co., Ltd. fair value in minutes.
Discounted Cash Flow (DCF) - (USD MM)
| Year | AY1 2020 |
AY2 2021 |
AY3 2022 |
AY4 2023 |
AY5 2024 |
FY1 2025 |
FY2 2026 |
FY3 2027 |
FY4 2028 |
FY5 2029 |
|---|---|---|---|---|---|---|---|---|---|---|
| Revenue | 12,846.3 | 21,287.7 | 24,600.0 | 20,811.0 | 19,030.8 | 21,757.6 | 24,875.2 | 28,439.4 | 32,514.4 | 37,173.2 |
| Revenue Growth, % | 0 | 65.71 | 15.56 | -15.4 | -8.55 | 14.33 | 14.33 | 14.33 | 14.33 | 14.33 |
| EBITDA | 2,257.1 | 5,404.3 | 4,777.6 | 2,372.1 | 963.3 | 3,430.7 | 3,922.2 | 4,484.2 | 5,126.8 | 5,861.3 |
| EBITDA, % | 17.57 | 25.39 | 19.42 | 11.4 | 5.06 | 15.77 | 15.77 | 15.77 | 15.77 | 15.77 |
| Depreciation | 863.1 | 1,102.9 | 1,414.0 | 1,599.2 | 2,020.7 | 1,564.3 | 1,788.5 | 2,044.7 | 2,337.7 | 2,672.7 |
| Depreciation, % | 6.72 | 5.18 | 5.75 | 7.68 | 10.62 | 7.19 | 7.19 | 7.19 | 7.19 | 7.19 |
| EBIT | 1,394.1 | 4,301.4 | 3,363.7 | 772.9 | -1,057.4 | 1,866.3 | 2,133.8 | 2,439.5 | 2,789.0 | 3,188.7 |
| EBIT, % | 10.85 | 20.21 | 13.67 | 3.71 | -5.56 | 8.58 | 8.58 | 8.58 | 8.58 | 8.58 |
| Total Cash | 2,769.9 | 1,491.0 | 6,905.9 | 6,150.3 | 4,735.8 | 4,833.5 | 5,526.1 | 6,317.9 | 7,223.2 | 8,258.2 |
| Total Cash, percent | .0 | .0 | .0 | .0 | .0 | .0 | .0 | .0 | .0 | .0 |
| Account Receivables | 3,333.8 | 2,748.9 | 2,791.4 | 1,493.7 | 2,587.1 | 3,088.8 | 3,531.4 | 4,037.4 | 4,615.9 | 5,277.3 |
| Account Receivables, % | 25.95 | 12.91 | 11.35 | 7.18 | 13.59 | 14.2 | 14.2 | 14.2 | 14.2 | 14.2 |
| Inventories | 794.0 | 1,379.8 | 1,323.8 | 1,371.2 | 1,569.4 | 1,430.7 | 1,635.8 | 1,870.1 | 2,138.1 | 2,444.5 |
| Inventories, % | 6.18 | 6.48 | 5.38 | 6.59 | 8.25 | 6.58 | 6.58 | 6.58 | 6.58 | 6.58 |
| Accounts Payable | 6,697.4 | 7,089.6 | 9,166.2 | 13,405.0 | 14,970.9 | 11,565.4 | 13,222.6 | 15,117.2 | 17,283.3 | 19,759.7 |
| Accounts Payable, % | 52.13 | 33.3 | 37.26 | 64.41 | 78.67 | 53.16 | 53.16 | 53.16 | 53.16 | 53.16 |
| Capital Expenditure | -2,626.3 | -2,056.1 | -2,668.4 | -5,505.6 | -3,228.9 | -3,671.5 | -4,197.5 | -4,799.0 | -5,486.6 | -6,272.8 |
| Capital Expenditure, % | -20.44 | -9.66 | -10.85 | -26.46 | -16.97 | -16.87 | -16.87 | -16.87 | -16.87 | -16.87 |
| Tax Rate, % | 25.77 | 25.77 | 25.77 | 25.77 | 25.77 | 25.77 | 25.77 | 25.77 | 25.77 | 25.77 |
| EBITAT | 850.4 | 2,677.4 | 2,481.4 | 583.9 | -784.9 | 1,294.5 | 1,480.0 | 1,692.0 | 1,934.5 | 2,211.6 |
| Depreciation | ||||||||||
| Changes in Account Receivables | ||||||||||
| Changes in Inventories | ||||||||||
| Changes in Accounts Payable | ||||||||||
| Capital Expenditure | ||||||||||
| UFCF | 1,656.7 | 2,115.4 | 3,317.2 | 2,166.4 | -1,718.8 | -4,581.2 | 80.5 | 92.0 | 105.2 | 120.2 |
| WACC, % | 7.42 | 7.44 | 7.64 | 7.68 | 7.65 | 7.57 | 7.57 | 7.57 | 7.57 | 7.57 |
| PV UFCF | ||||||||||
| SUM PV UFCF | -3,953.5 | |||||||||
| Long Term Growth Rate, % | 2.00 | |||||||||
| Free cash flow (T + 1) | 123 | |||||||||
| Terminal Value | 2,203 | |||||||||
| Present Terminal Value | 1,529 | |||||||||
| Enterprise Value | -2,424 | |||||||||
| Net Debt | 2,630 | |||||||||
| Equity Value | -5,054 | |||||||||
| Diluted Shares Outstanding, MM | 4,394 | |||||||||
| Equity Value Per Share | -1.15 |
What You Will Receive
- Authentic Shanxi Meijin Data: Comprehensive financials – including revenue and EBIT – derived from actual and projected metrics.
- Complete Customization: Modify all essential parameters (yellow cells) such as WACC, growth %, and tax rates.
- Instant Valuation Adjustments: Automatic recalculations to evaluate the impact of changes on the fair value of Shanxi Meijin Energy Co., Ltd. (000723SZ).
- Flexible Excel Template: Designed for easy edits, scenario analysis, and detailed forecasting.
- Efficient and Precise: Avoid the hassle of building models from the ground up while ensuring accuracy and adaptability.
Key Features
- Pre-Loaded Data: Comprehensive historical financial statements and projections for Shanxi Meijin Energy Co., Ltd. (000723SZ).
- Fully Customizable Inputs: Modify WACC, tax rates, revenue growth, and EBITDA margins to suit your analysis.
- Real-Time Results: Watch the intrinsic value of Shanxi Meijin Energy Co., Ltd. (000723SZ) update instantly.
- Intuitive Visual Outputs: Clear dashboard charts illustrate valuation outcomes and essential metrics.
- Designed for Precision: A reliable tool crafted for analysts, investors, and finance professionals.
How It Functions
- Step 1: Download the Excel spreadsheet.
- Step 2: Examine Shanxi Meijin Energy Co., Ltd.'s pre-filled financial data and projections.
- Step 3: Adjust key parameters such as revenue growth, WACC, and tax rates (highlighted fields).
- Step 4: Observe the DCF model refresh in real-time as you adjust your assumptions.
- Step 5: Evaluate the results and leverage them for informed investment choices.
Why Opt for This Calculator?
- All-in-One Solution: Features DCF, WACC, and financial ratio analyses for comprehensive evaluations.
- Flexible Inputs: Modify the yellow-highlighted fields to explore different scenarios.
- In-Depth Analysis: Automatically computes Shanxi Meijin Energy Co., Ltd.'s intrinsic value and Net Present Value.
- Data Ready: Contains historical and projected data for reliable initial assessments.
- High-Quality Standards: Perfect for financial analysts, investors, and business consultants working with (000723SZ).
Who Can Benefit from This Product?
- Individual Investors: Make informed decisions regarding buying or selling shares of Shanxi Meijin Energy Co., Ltd. (000723SZ).
- Financial Analysts: Enhance valuation processes with accessible financial models tailored for Shanxi Meijin Energy Co., Ltd.
- Consultants: Provide clients with timely and precise valuation insights for Shanxi Meijin Energy Co., Ltd. (000723SZ).
- Business Owners: Gain an understanding of how major companies like Shanxi Meijin Energy Co., Ltd. are valued to inform your own business strategies.
- Finance Students: Explore valuation techniques using real-world data and case studies from Shanxi Meijin Energy Co., Ltd. (000723SZ).
Contents of the Template
- Operating and Balance Sheet Data: Pre-filled historical data and forecasts for Shanxi Meijin Energy Co., Ltd. (000723SZ), covering revenue, EBITDA, EBIT, and capital expenditures.
- WACC Calculation: A dedicated worksheet for calculating the Weighted Average Cost of Capital (WACC), featuring parameters such as Beta, risk-free rate, and share price.
- DCF Valuation (Unlevered and Levered): Customizable Discounted Cash Flow models with detailed calculations to determine intrinsic value.
- Financial Statements: Pre-loaded annual and quarterly financial statements to facilitate comprehensive analysis.
- Key Ratios: A compilation of profitability, leverage, and efficiency ratios specifically for Shanxi Meijin Energy Co., Ltd. (000723SZ).
- Dashboard and Charts: A visual overview of valuation results and underlying assumptions for easier analysis.
Disclaimer
All information, articles, and product details provided on this website are for general informational and educational purposes only. We do not claim any ownership over, nor do we intend to infringe upon, any trademarks, copyrights, logos, brand names, or other intellectual property mentioned or depicted on this site. Such intellectual property remains the property of its respective owners, and any references here are made solely for identification or informational purposes, without implying any affiliation, endorsement, or partnership.
We make no representations or warranties, express or implied, regarding the accuracy, completeness, or suitability of any content or products presented. Nothing on this website should be construed as legal, tax, investment, financial, medical, or other professional advice. In addition, no part of this site—including articles or product references—constitutes a solicitation, recommendation, endorsement, advertisement, or offer to buy or sell any securities, franchises, or other financial instruments, particularly in jurisdictions where such activity would be unlawful.
All content is of a general nature and may not address the specific circumstances of any individual or entity. It is not a substitute for professional advice or services. Any actions you take based on the information provided here are strictly at your own risk. You accept full responsibility for any decisions or outcomes arising from your use of this website and agree to release us from any liability in connection with your use of, or reliance upon, the content or products found herein.