
|
CITIC Guoan Information Industry Co.، Ltd. (000839.SZ) تقييم DCF |
Fully Editable: Tailor To Your Needs In Excel Or Sheets
Professional Design: Trusted, Industry-Standard Templates
Investor-Approved Valuation Models
MAC/PC Compatible, Fully Unlocked
No Expertise Is Needed; Easy To Follow
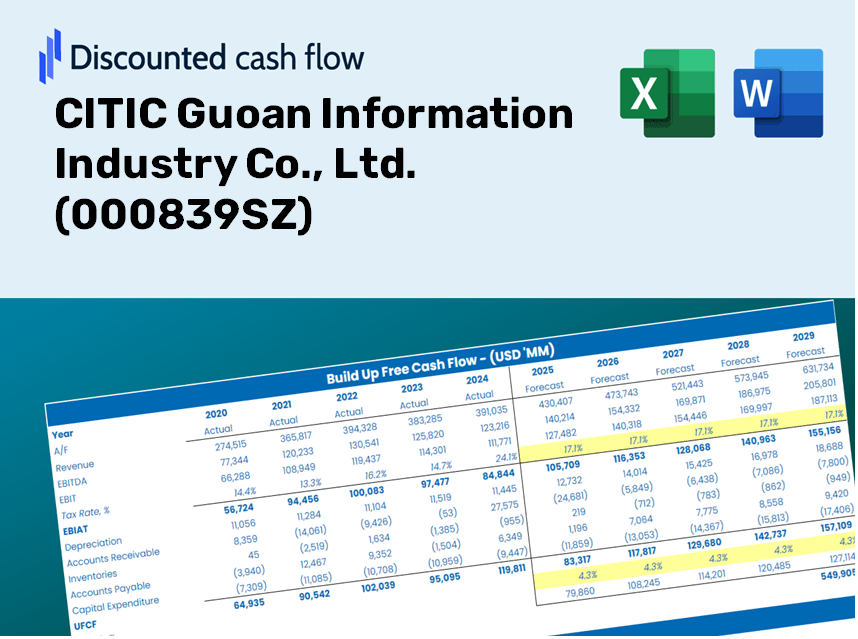
CITIC Guoan Information Industry Co., Ltd. (000839.SZ) Bundle
Engineered for accuracy, our (000839SZ) DCF Calculator allows you to evaluate CITIC Guoan Information Industry Co., Ltd. valuation using actual financial data, offering complete flexibility to modify all key parameters for enhanced projections.
Discounted Cash Flow (DCF) - (USD MM)
| Year | AY1 2020 |
AY2 2021 |
AY3 2022 |
AY4 2023 |
AY5 2024 |
FY1 2025 |
FY2 2026 |
FY3 2027 |
FY4 2028 |
FY5 2029 |
|---|---|---|---|---|---|---|---|---|---|---|
| Revenue | 2,358.9 | 2,660.4 | 2,706.7 | 2,981.6 | 3,395.4 | 3,722.6 | 4,081.5 | 4,474.9 | 4,906.2 | 5,379.1 |
| Revenue Growth, % | 0 | 12.78 | 1.74 | 10.16 | 13.88 | 9.64 | 9.64 | 9.64 | 9.64 | 9.64 |
| EBITDA | 13.2 | -395.3 | -775.6 | 160.3 | 152.7 | -246.3 | -270.0 | -296.0 | -324.6 | -355.9 |
| EBITDA, % | 0.56143 | -14.86 | -28.65 | 5.38 | 4.5 | -6.62 | -6.62 | -6.62 | -6.62 | -6.62 |
| Depreciation | 341.2 | 179.4 | 74.1 | 32.6 | 26.4 | 192.2 | 210.7 | 231.1 | 253.3 | 277.7 |
| Depreciation, % | 14.46 | 6.74 | 2.74 | 1.09 | 0.77744 | 5.16 | 5.16 | 5.16 | 5.16 | 5.16 |
| EBIT | -328.0 | -574.7 | -849.7 | 127.7 | 126.3 | -438.5 | -480.8 | -527.1 | -577.9 | -633.6 |
| EBIT, % | -13.9 | -21.6 | -31.39 | 4.28 | 3.72 | -11.78 | -11.78 | -11.78 | -11.78 | -11.78 |
| Total Cash | 750.4 | 771.9 | 443.7 | 445.1 | 473.0 | 789.7 | 865.9 | 949.3 | 1,040.8 | 1,141.2 |
| Total Cash, percent | .0 | .0 | .0 | .0 | .0 | .0 | .0 | .0 | .0 | .0 |
| Account Receivables | 1,313.6 | 1,062.7 | 766.6 | 893.1 | 1,068.5 | 1,380.2 | 1,513.2 | 1,659.1 | 1,819.0 | 1,994.3 |
| Account Receivables, % | 55.69 | 39.94 | 28.32 | 29.95 | 31.47 | 37.08 | 37.08 | 37.08 | 37.08 | 37.08 |
| Inventories | 2,480.8 | 2,103.6 | 1,167.5 | 1,349.9 | 1,206.0 | 2,255.9 | 2,473.3 | 2,711.7 | 2,973.1 | 3,259.7 |
| Inventories, % | 105.17 | 79.07 | 43.13 | 45.27 | 35.52 | 60.6 | 60.6 | 60.6 | 60.6 | 60.6 |
| Accounts Payable | 1,614.8 | 1,448.3 | 401.3 | 498.3 | 489.9 | 1,257.2 | 1,378.4 | 1,511.3 | 1,656.9 | 1,816.7 |
| Accounts Payable, % | 68.45 | 54.44 | 14.83 | 16.71 | 14.43 | 33.77 | 33.77 | 33.77 | 33.77 | 33.77 |
| Capital Expenditure | -181.9 | -13.5 | -97.8 | -28.4 | -33.7 | -102.5 | -112.4 | -123.3 | -135.1 | -148.2 |
| Capital Expenditure, % | -7.71 | -0.50695 | -3.61 | -0.95282 | -0.9913 | -2.75 | -2.75 | -2.75 | -2.75 | -2.75 |
| Tax Rate, % | 2999.34 | 2999.34 | 2999.34 | 2999.34 | 2999.34 | 2999.34 | 2999.34 | 2999.34 | 2999.34 | 2999.34 |
| EBITAT | -299.3 | -464.5 | -649.1 | 289.4 | -3,661.7 | -305.6 | -335.1 | -367.3 | -402.8 | -441.6 |
| Depreciation | ||||||||||
| Changes in Account Receivables | ||||||||||
| Changes in Inventories | ||||||||||
| Changes in Accounts Payable | ||||||||||
| Capital Expenditure | ||||||||||
| UFCF | -2,319.6 | 163.0 | -487.6 | 81.8 | -3,708.9 | -810.2 | -466.0 | -510.9 | -560.2 | -614.2 |
| WACC, % | 5.61 | 5.51 | 5.47 | 5.7 | 4.71 | 5.4 | 5.4 | 5.4 | 5.4 | 5.4 |
| PV UFCF | ||||||||||
| SUM PV UFCF | -2,550.7 | |||||||||
| Long Term Growth Rate, % | 2.00 | |||||||||
| Free cash flow (T + 1) | -626 | |||||||||
| Terminal Value | -18,432 | |||||||||
| Present Terminal Value | -14,171 | |||||||||
| Enterprise Value | -16,722 | |||||||||
| Net Debt | 158 | |||||||||
| Equity Value | -16,880 | |||||||||
| Diluted Shares Outstanding, MM | 3,929 | |||||||||
| Equity Value Per Share | -4.30 |
What You'll Receive
- Customizable Excel Template: An adaptable Excel-based DCF Calculator featuring pre-filled financial data for CITIC Guoan Information Industry Co., Ltd. (000839SZ).
- Up-to-Date Data: Access to historical figures and forward-looking projections (highlighted in the yellow cells).
- Flexible Forecasting: Modify assumptions on revenue growth, EBITDA %, and WACC to suit your analysis.
- Instant Calculations: Quickly observe how your adjustments influence CITIC Guoan's valuation.
- Professional Resource: Designed for investors, CFOs, consultants, and financial analysts.
- User-Centric Layout: Organized for simplicity and efficiency, complete with step-by-step guidance.
Key Features
- Advanced DCF Calculator: Offers comprehensive unlevered and levered DCF valuation models.
- WACC Calculator: Ready-to-use Weighted Average Cost of Capital template with adjustable inputs.
- Customizable Forecast Assumptions: Tailor growth rates, capital expenditures, and discount rates as needed.
- Integrated Financial Ratios: Evaluate profitability, leverage, and efficiency ratios specific to CITIC Guoan Information Industry Co., Ltd. (000839SZ).
- Dashboard and Visualizations: Graphical outputs provide a summary of essential valuation metrics for straightforward analysis.
How It Works
- Step 1: Download the Excel file.
- Step 2: Examine CITIC Guoan Information Industry Co., Ltd.'s pre-filled financial data and projections.
- Step 3: Adjust essential inputs such as revenue growth, WACC, and tax rates (highlighted cells).
- Step 4: Observe the DCF model update in real-time as you modify your assumptions.
- Step 5: Evaluate the outputs and utilize the findings for your investment strategies.
Why Opt for This Calculator for CITIC Guoan Information Industry Co., Ltd. (000839SZ)?
- Precise Financial Data: Utilize accurate financials from CITIC Guoan to ensure trustworthy valuation results.
- Customizable Features: Modify essential inputs such as growth rates, WACC, and tax rates to align with your forecasts.
- Efficiency: Ready-made calculations save you time and eliminate the hassle of starting from zero.
- Professional-Quality Tool: Crafted for investors, analysts, and consultants looking for in-depth insights.
- User-Friendly Interface: Intuitive design and clear, step-by-step guidance make it accessible for all users.
Who Can Benefit from This Product?
- Individual Investors: Make educated choices regarding the purchase or sale of CITIC Guoan Information Industry Co., Ltd. (000839SZ) stock.
- Financial Analysts: Enhance valuation methodologies with readily available financial models.
- Consultants: Provide precise and timely valuation insights to clients.
- Business Owners: Gain insights into how companies like CITIC Guoan are valued to inform your strategic planning.
- Finance Students: Acquire valuation skills through the analysis of real-world data and case studies.
Contents of the Template
- Detailed DCF Model: Fully editable template equipped with extensive valuation calculations.
- Real-World Financial Data: Preloaded historical and projected financials for CITIC Guoan Information Industry Co., Ltd. (000839SZ) for thorough analysis.
- Customizable Variables: Modify WACC, growth rates, and tax assumptions to explore various scenarios.
- Comprehensive Financial Statements: Complete annual and quarterly financial breakdowns for enhanced insights.
- Essential Ratios: Integrated analysis tools for assessing profitability, efficiency, and leverage.
- Dashboard with Visual Data Representations: Graphs and tables that present clear, actionable insights.
Disclaimer
All information, articles, and product details provided on this website are for general informational and educational purposes only. We do not claim any ownership over, nor do we intend to infringe upon, any trademarks, copyrights, logos, brand names, or other intellectual property mentioned or depicted on this site. Such intellectual property remains the property of its respective owners, and any references here are made solely for identification or informational purposes, without implying any affiliation, endorsement, or partnership.
We make no representations or warranties, express or implied, regarding the accuracy, completeness, or suitability of any content or products presented. Nothing on this website should be construed as legal, tax, investment, financial, medical, or other professional advice. In addition, no part of this site—including articles or product references—constitutes a solicitation, recommendation, endorsement, advertisement, or offer to buy or sell any securities, franchises, or other financial instruments, particularly in jurisdictions where such activity would be unlawful.
All content is of a general nature and may not address the specific circumstances of any individual or entity. It is not a substitute for professional advice or services. Any actions you take based on the information provided here are strictly at your own risk. You accept full responsibility for any decisions or outcomes arising from your use of this website and agree to release us from any liability in connection with your use of, or reliance upon, the content or products found herein.