
|
شركة Jiangxi Ganneng Co. ، Ltd. (000899.SZ) تقييم DCF |
Fully Editable: Tailor To Your Needs In Excel Or Sheets
Professional Design: Trusted, Industry-Standard Templates
Investor-Approved Valuation Models
MAC/PC Compatible, Fully Unlocked
No Expertise Is Needed; Easy To Follow
Jiangxi Ganneng Co., Ltd. (000899.SZ) Bundle
Enhance your investment choices with the Jiangxi Ganneng Co., Ltd. (000899SZ) DCF Calculator! Utilize real financial data, adjust growth projections and expenses, and instantly observe how these changes affect the intrinsic value of Jiangxi Ganneng Co., Ltd. (000899SZ).
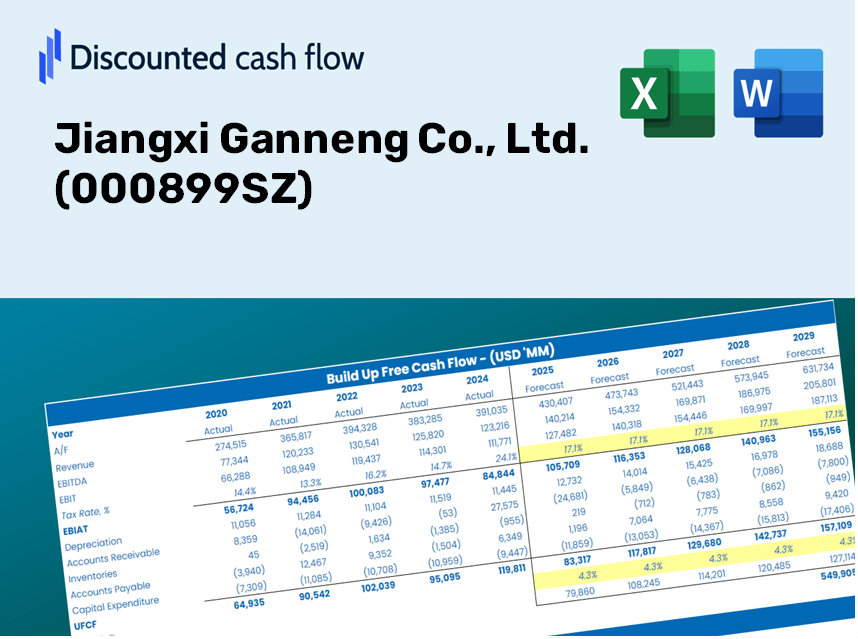
Discounted Cash Flow (DCF) - (USD MM)
| Year | AY1 2020 |
AY2 2021 |
AY3 2022 |
AY4 2023 |
AY5 2024 |
FY1 2025 |
FY2 2026 |
FY3 2027 |
FY4 2028 |
FY5 2029 |
|---|---|---|---|---|---|---|---|---|---|---|
| Revenue | 2,677.2 | 2,699.6 | 4,142.7 | 7,088.9 | 6,920.9 | 9,049.9 | 11,833.7 | 15,473.8 | 20,233.6 | 26,457.6 |
| Revenue Growth, % | 0 | 0.83555 | 53.46 | 71.12 | -2.37 | 30.76 | 30.76 | 30.76 | 30.76 | 30.76 |
| EBITDA | 664.0 | 23.1 | 423.8 | 1,190.5 | 1,429.8 | 1,327.4 | 1,735.7 | 2,269.7 | 2,967.8 | 3,880.7 |
| EBITDA, % | 24.8 | 0.85473 | 10.23 | 16.79 | 20.66 | 14.67 | 14.67 | 14.67 | 14.67 | 14.67 |
| Depreciation | 268.1 | 263.2 | 342.8 | 549.6 | 605.9 | 806.3 | 1,054.3 | 1,378.6 | 1,802.6 | 2,357.1 |
| Depreciation, % | 10.01 | 9.75 | 8.27 | 7.75 | 8.76 | 8.91 | 8.91 | 8.91 | 8.91 | 8.91 |
| EBIT | 395.9 | -240.1 | 81.0 | 640.9 | 823.9 | 521.2 | 681.5 | 891.1 | 1,165.2 | 1,523.6 |
| EBIT, % | 14.79 | -8.89 | 1.95 | 9.04 | 11.9 | 5.76 | 5.76 | 5.76 | 5.76 | 5.76 |
| Total Cash | 528.3 | 758.8 | 783.3 | 450.8 | 313.0 | 1,405.1 | 1,837.3 | 2,402.5 | 3,141.5 | 4,107.9 |
| Total Cash, percent | .0 | .0 | .0 | .0 | .0 | .0 | .0 | .0 | .0 | .0 |
| Account Receivables | 727.1 | 221.3 | 490.0 | 801.5 | 786.0 | 1,264.2 | 1,653.1 | 2,161.6 | 2,826.5 | 3,695.9 |
| Account Receivables, % | 27.16 | 8.2 | 11.83 | 11.31 | 11.36 | 13.97 | 13.97 | 13.97 | 13.97 | 13.97 |
| Inventories | 137.0 | 324.3 | 389.3 | 352.6 | 411.7 | 677.8 | 886.3 | 1,159.0 | 1,515.5 | 1,981.6 |
| Inventories, % | 5.12 | 12.01 | 9.4 | 4.97 | 5.95 | 7.49 | 7.49 | 7.49 | 7.49 | 7.49 |
| Accounts Payable | 237.5 | 612.3 | 777.1 | 761.6 | 1,312.1 | 1,448.2 | 1,893.6 | 2,476.1 | 3,237.8 | 4,233.8 |
| Accounts Payable, % | 8.87 | 22.68 | 18.76 | 10.74 | 18.96 | 16 | 16 | 16 | 16 | 16 |
| Capital Expenditure | -584.4 | -1,604.9 | -1,523.6 | -2,533.8 | -3,703.3 | -3,752.2 | -4,906.4 | -6,415.7 | -8,389.2 | -10,969.8 |
| Capital Expenditure, % | -21.83 | -59.45 | -36.78 | -35.74 | -53.51 | -41.46 | -41.46 | -41.46 | -41.46 | -41.46 |
| Tax Rate, % | -0.31855 | -0.31855 | -0.31855 | -0.31855 | -0.31855 | -0.31855 | -0.31855 | -0.31855 | -0.31855 | -0.31855 |
| EBITAT | 348.9 | -242.2 | 52.2 | 638.1 | 826.5 | 471.3 | 616.3 | 805.9 | 1,053.7 | 1,377.9 |
| Depreciation | ||||||||||
| Changes in Account Receivables | ||||||||||
| Changes in Inventories | ||||||||||
| Changes in Accounts Payable | ||||||||||
| Capital Expenditure | ||||||||||
| UFCF | -594.0 | -890.6 | -1,297.4 | -1,636.4 | -1,763.9 | -3,083.0 | -3,387.8 | -4,429.9 | -5,792.6 | -7,574.4 |
| WACC, % | 4.48 | 4.7 | 4.05 | 4.69 | 4.7 | 4.52 | 4.52 | 4.52 | 4.52 | 4.52 |
| PV UFCF | ||||||||||
| SUM PV UFCF | -20,854.3 | |||||||||
| Long Term Growth Rate, % | 3.00 | |||||||||
| Free cash flow (T + 1) | -7,802 | |||||||||
| Terminal Value | -512,201 | |||||||||
| Present Terminal Value | -410,561 | |||||||||
| Enterprise Value | -431,416 | |||||||||
| Net Debt | 9,184 | |||||||||
| Equity Value | -440,600 | |||||||||
| Diluted Shares Outstanding, MM | 978 | |||||||||
| Equity Value Per Share | -450.44 |
What You Will Receive
- Authentic Jiangxi Ganneng Data: Preloaded financial information – from revenue to EBIT – derived from actual and projected metrics.
- Comprehensive Customization: Modify all essential parameters (yellow cells) such as WACC, growth %, and tax rates.
- Instant Valuation Updates: Automatic recalculations to evaluate the impact of changes on Jiangxi Ganneng’s fair value.
- Flexible Excel Template: Designed for quick adjustments, scenario analysis, and detailed forecasts.
- Efficient and Precise: Avoid the hassle of creating models from the ground up while ensuring accuracy and flexibility.
Key Features
- Authentic Financial Data: Gain access to reliable pre-loaded historical figures and forward-looking forecasts for Jiangxi Ganneng Co., Ltd. (000899SZ).
- Adjustable Forecast Parameters: Modify highlighted cells for key metrics such as WACC, growth rates, and profit margins.
- Real-Time Calculations: Enjoy automatic updates for DCF, Net Present Value (NPV), and cash flow assessments.
- User-Friendly Dashboard: Clear and engaging charts, along with summaries, to effectively showcase your valuation outcomes.
- Designed for Everyone: A straightforward and intuitive layout tailored for investors, CFOs, and consultants alike.
How It Works
- Step 1: Download the Excel file.
- Step 2: Review the pre-loaded data for Jiangxi Ganneng Co., Ltd. (000899SZ) (historical and projected).
- Step 3: Modify key assumptions (yellow cells) according to your analysis.
- Step 4: Observe real-time recalculations of Jiangxi Ganneng’s intrinsic value.
- Step 5: Utilize the results for making investment decisions or for reporting purposes.
Why Choose the Jiangxi Ganneng Co., Ltd. Calculator?
- Precision: Utilizing accurate financial data from Jiangxi Ganneng Co., Ltd. to ensure reliability.
- Versatility: Specifically designed for users to easily experiment with and adjust inputs.
- Efficiency: Eliminate the complexities of building a DCF model from the ground up.
- Professional Quality: Crafted with the rigor and usability expected at the CFO level.
- User-Friendly: Intuitive interface suitable for users without extensive financial modeling background.
Who Can Benefit from Jiangxi Ganneng Co., Ltd. (000899SZ)?
- Investors: Make informed choices with our reliable valuation tools tailored for your needs.
- Financial Analysts: Streamline your workflow with our customizable, pre-designed DCF model.
- Consultants: Effortlessly modify our templates for impactful client presentations and comprehensive reports.
- Finance Enthusiasts: Enhance your knowledge of valuation methodologies through practical, real-world scenarios.
- Educators and Students: Utilize our resources as an effective educational tool in finance curriculum.
Contents of the Template
- Pre-Filled Data: Contains Jiangxi Ganneng Co., Ltd.’s historical financial information and projections.
- Discounted Cash Flow Model: An editable DCF valuation model with automatic calculation features.
- Weighted Average Cost of Capital (WACC): A separate sheet for calculating WACC using custom parameters.
- Key Financial Ratios: Evaluate Jiangxi Ganneng Co., Ltd.'s profitability, efficiency, and financial leverage.
- Customizable Inputs: Easily modify revenue growth rates, margins, and tax assumptions.
- Clear Dashboard: Visual representations, including charts and tables, summarizing key valuation metrics.
Disclaimer
All information, articles, and product details provided on this website are for general informational and educational purposes only. We do not claim any ownership over, nor do we intend to infringe upon, any trademarks, copyrights, logos, brand names, or other intellectual property mentioned or depicted on this site. Such intellectual property remains the property of its respective owners, and any references here are made solely for identification or informational purposes, without implying any affiliation, endorsement, or partnership.
We make no representations or warranties, express or implied, regarding the accuracy, completeness, or suitability of any content or products presented. Nothing on this website should be construed as legal, tax, investment, financial, medical, or other professional advice. In addition, no part of this site—including articles or product references—constitutes a solicitation, recommendation, endorsement, advertisement, or offer to buy or sell any securities, franchises, or other financial instruments, particularly in jurisdictions where such activity would be unlawful.
All content is of a general nature and may not address the specific circumstances of any individual or entity. It is not a substitute for professional advice or services. Any actions you take based on the information provided here are strictly at your own risk. You accept full responsibility for any decisions or outcomes arising from your use of this website and agree to release us from any liability in connection with your use of, or reliance upon, the content or products found herein.