
|
شركة Beijing Shougang Co. ، Ltd. (000959.SZ) تقييم DCF |
Fully Editable: Tailor To Your Needs In Excel Or Sheets
Professional Design: Trusted, Industry-Standard Templates
Investor-Approved Valuation Models
MAC/PC Compatible, Fully Unlocked
No Expertise Is Needed; Easy To Follow
Beijing Shougang Co., Ltd. (000959.SZ) Bundle
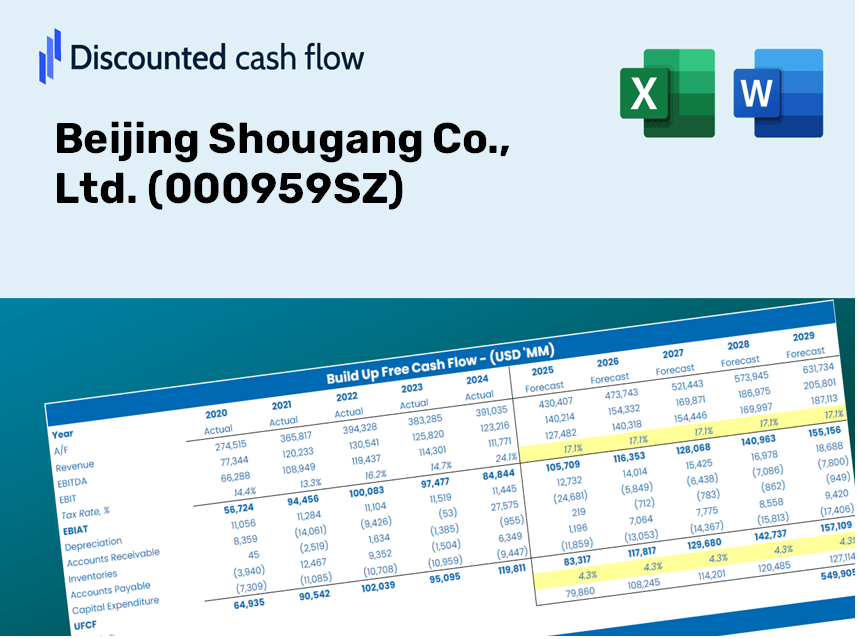
Save time and boost precision with our (000959SZ) DCF Calculator! Equipped with real data from Beijing Shougang Co., Ltd. and customizable assumptions, this tool enables you to forecast, analyze, and value Beijing Shougang like a seasoned investor.
Discounted Cash Flow (DCF) - (USD MM)
| Year | AY1 2020 |
AY2 2021 |
AY3 2022 |
AY4 2023 |
AY5 2024 |
FY1 2025 |
FY2 2026 |
FY3 2027 |
FY4 2028 |
FY5 2029 |
|---|---|---|---|---|---|---|---|---|---|---|
| Revenue | 79,951.2 | 132,984.3 | 118,142.2 | 113,761.4 | 108,310.8 | 117,544.1 | 127,564.5 | 138,439.2 | 150,240.9 | 163,048.7 |
| Revenue Growth, % | 0 | 66.33 | -11.16 | -3.71 | -4.79 | 8.52 | 8.52 | 8.52 | 8.52 | 8.52 |
| EBITDA | 10,835.1 | 19,585.2 | 11,574.7 | 10,199.6 | 9,841.8 | 13,195.3 | 14,320.2 | 15,541.0 | 16,865.8 | 18,303.6 |
| EBITDA, % | 13.55 | 14.73 | 9.8 | 8.97 | 9.09 | 11.23 | 11.23 | 11.23 | 11.23 | 11.23 |
| Depreciation | 6,517.9 | 7,516.2 | 7,781.2 | 7,920.4 | 7,955.4 | 8,157.1 | 8,852.4 | 9,607.1 | 10,426.1 | 11,314.9 |
| Depreciation, % | 8.15 | 5.65 | 6.59 | 6.96 | 7.34 | 6.94 | 6.94 | 6.94 | 6.94 | 6.94 |
| EBIT | 4,317.2 | 12,069.1 | 3,793.5 | 2,279.2 | 1,886.3 | 5,038.3 | 5,467.8 | 5,933.9 | 6,439.8 | 6,988.8 |
| EBIT, % | 5.4 | 9.08 | 3.21 | 2 | 1.74 | 4.29 | 4.29 | 4.29 | 4.29 | 4.29 |
| Total Cash | 6,292.5 | 10,285.0 | 9,470.5 | 9,153.2 | 8,777.3 | 9,349.5 | 10,146.6 | 11,011.5 | 11,950.3 | 12,969.0 |
| Total Cash, percent | .0 | .0 | .0 | .0 | .0 | .0 | .0 | .0 | .0 | .0 |
| Account Receivables | 12,076.2 | 12,524.2 | 12,469.0 | 7,547.2 | 9,492.7 | 11,866.1 | 12,877.7 | 13,975.5 | 15,166.9 | 16,459.8 |
| Account Receivables, % | 15.1 | 9.42 | 10.55 | 6.63 | 8.76 | 10.1 | 10.1 | 10.1 | 10.1 | 10.1 |
| Inventories | 10,599.7 | 11,900.6 | 11,960.2 | 12,177.6 | 11,370.9 | 12,585.0 | 13,657.9 | 14,822.2 | 16,085.7 | 17,457.0 |
| Inventories, % | 13.26 | 8.95 | 10.12 | 10.7 | 10.5 | 10.71 | 10.71 | 10.71 | 10.71 | 10.71 |
| Accounts Payable | 24,767.2 | 27,686.4 | 20,922.2 | 24,167.8 | 18,690.5 | 25,391.2 | 27,555.8 | 29,904.8 | 32,454.2 | 35,220.8 |
| Accounts Payable, % | 30.98 | 20.82 | 17.71 | 21.24 | 17.26 | 21.6 | 21.6 | 21.6 | 21.6 | 21.6 |
| Capital Expenditure | -3,032.5 | -3,015.8 | -2,639.0 | -1,766.4 | -227.2 | -2,364.3 | -2,565.9 | -2,784.6 | -3,022.0 | -3,279.6 |
| Capital Expenditure, % | -3.79 | -2.27 | -2.23 | -1.55 | -0.20981 | -2.01 | -2.01 | -2.01 | -2.01 | -2.01 |
| Tax Rate, % | 36.82 | 36.82 | 36.82 | 36.82 | 36.82 | 36.82 | 36.82 | 36.82 | 36.82 | 36.82 |
| EBITAT | 2,776.3 | 8,656.6 | 2,379.1 | 1,680.4 | 1,191.8 | 3,382.3 | 3,670.6 | 3,983.5 | 4,323.1 | 4,691.6 |
| Depreciation | ||||||||||
| Changes in Account Receivables | ||||||||||
| Changes in Inventories | ||||||||||
| Changes in Accounts Payable | ||||||||||
| Capital Expenditure | ||||||||||
| UFCF | 8,352.9 | 14,327.4 | 752.5 | 15,784.4 | 2,303.9 | 12,288.2 | 10,037.3 | 10,893.0 | 11,821.6 | 12,829.3 |
| WACC, % | 4 | 4.14 | 3.97 | 4.18 | 3.98 | 4.05 | 4.05 | 4.05 | 4.05 | 4.05 |
| PV UFCF | ||||||||||
| SUM PV UFCF | 51,349.4 | |||||||||
| Long Term Growth Rate, % | 2.00 | |||||||||
| Free cash flow (T + 1) | 13,086 | |||||||||
| Terminal Value | 636,920 | |||||||||
| Present Terminal Value | 522,131 | |||||||||
| Enterprise Value | 573,480 | |||||||||
| Net Debt | 25,803 | |||||||||
| Equity Value | 547,677 | |||||||||
| Diluted Shares Outstanding, MM | 7,761 | |||||||||
| Equity Value Per Share | 70.57 |
What You Will Receive
- Customizable Excel Template: A comprehensive Excel-based DCF Calculator featuring pre-loaded financial data for Beijing Shougang Co., Ltd. (000959SZ).
- Accurate Data Insights: Access to historical performance metrics and forward-looking projections (highlighted in the yellow cells).
- Adjustable Forecasts: Modify key assumptions including revenue growth rates, EBITDA percentages, and WACC.
- Instant Calculations: See immediate effects of your inputs on the valuation of Beijing Shougang Co., Ltd. (000959SZ).
- Professional-Grade Tool: Designed for investors, CFOs, consultants, and financial analysts.
- Intuitive Layout: Organized for user-friendliness and straightforward navigation, complete with detailed instructions.
Key Features
- Comprehensive Financial Data: Access reliable pre-loaded historical financials and future forecasts for Beijing Shougang Co., Ltd. (000959SZ).
- Tailored Forecast Inputs: Modify key assumptions highlighted in yellow, including WACC, growth rates, and profit margins.
- Real-Time Calculations: Enjoy automatic updates to DCF, Net Present Value (NPV), and cash flow assessments.
- Interactive Visualization Dashboard: User-friendly charts and summaries for a clear view of your valuation results.
- Designed for All Levels: An intuitive framework suitable for investors, CFOs, and consultants, whether you're a novice or an expert.
How It Functions
- Step 1: Download the pre-built Excel template featuring Beijing Shougang Co., Ltd.'s data.
- Step 2: Navigate through the pre-filled sheets to grasp the essential metrics.
- Step 3: Revise forecasts and assumptions in the editable yellow cells (WACC, growth, margins).
- Step 4: Instantly view the recalibrated results, including the intrinsic value of Beijing Shougang Co., Ltd. (000959SZ).
- Step 5: Make well-informed investment decisions or create reports based on the generated outputs.
Why Choose This Calculator for Beijing Shougang Co., Ltd. (000959SZ)?
- Designed for Industry Experts: A sophisticated tool utilized by financial analysts, CFOs, and industry consultants.
- Accurate Financial Data: Historical and projected financial data for Beijing Shougang Co., Ltd. preloaded for reliable analysis.
- Flexible Scenario Analysis: Easily simulate various forecasts and assumptions tailored to your needs.
- Insightful Outputs: Automatically computes intrinsic value, NPV, and other essential metrics.
- User-Friendly Interface: Comprehensive step-by-step instructions help you navigate the tool effortlessly.
Who Can Benefit from This Product?
- Individual Investors: Make well-informed decisions regarding the purchase or sale of Beijing Shougang Co., Ltd. (000959SZ) stock.
- Financial Analysts: Enhance valuation processes with accessible financial models tailored for Beijing Shougang Co., Ltd. (000959SZ).
- Consultants: Provide clients with timely and accurate valuation insights related to Beijing Shougang Co., Ltd. (000959SZ).
- Business Owners: Gain insights into the valuation of large firms like Beijing Shougang Co., Ltd. (000959SZ) to inform your own business strategy.
- Finance Students: Acquire valuation skills through the analysis of real-world data involving Beijing Shougang Co., Ltd. (000959SZ).
Components of the Template
- Operating and Balance Sheet Data: Pre-filled historical data and forecasts for Beijing Shougang Co., Ltd. (000959SZ), including revenue, EBITDA, EBIT, and capital expenditures.
- WACC Calculation: A specific sheet for calculating the Weighted Average Cost of Capital (WACC), featuring parameters such as Beta, risk-free rate, and share price.
- DCF Valuation (Unlevered and Levered): Customizable Discounted Cash Flow models that reveal intrinsic value along with detailed calculations.
- Financial Statements: Pre-loaded annual and quarterly financial statements to facilitate thorough analysis.
- Key Ratios: Contains important profitability, leverage, and efficiency ratios for Beijing Shougang Co., Ltd. (000959SZ).
- Dashboard and Charts: A visual overview of valuation outputs and assumptions to simplify result analysis.
Disclaimer
All information, articles, and product details provided on this website are for general informational and educational purposes only. We do not claim any ownership over, nor do we intend to infringe upon, any trademarks, copyrights, logos, brand names, or other intellectual property mentioned or depicted on this site. Such intellectual property remains the property of its respective owners, and any references here are made solely for identification or informational purposes, without implying any affiliation, endorsement, or partnership.
We make no representations or warranties, express or implied, regarding the accuracy, completeness, or suitability of any content or products presented. Nothing on this website should be construed as legal, tax, investment, financial, medical, or other professional advice. In addition, no part of this site—including articles or product references—constitutes a solicitation, recommendation, endorsement, advertisement, or offer to buy or sell any securities, franchises, or other financial instruments, particularly in jurisdictions where such activity would be unlawful.
All content is of a general nature and may not address the specific circumstances of any individual or entity. It is not a substitute for professional advice or services. Any actions you take based on the information provided here are strictly at your own risk. You accept full responsibility for any decisions or outcomes arising from your use of this website and agree to release us from any liability in connection with your use of, or reliance upon, the content or products found herein.