
|
CHN Energy Changyuan Electric Power Co. ، Ltd. (000966.SZ) تقييم DCF |
Fully Editable: Tailor To Your Needs In Excel Or Sheets
Professional Design: Trusted, Industry-Standard Templates
Investor-Approved Valuation Models
MAC/PC Compatible, Fully Unlocked
No Expertise Is Needed; Easy To Follow
CHN Energy Changyuan Electric Power Co., Ltd. (000966.SZ) Bundle
Optimize your time and improve precision with our (000966SZ) DCF Calculator! Utilizing real data from CHN Energy Changyuan Electric Power Co., Ltd. and customizable assumptions, this tool enables you to forecast, analyze, and value CHN Energy like a seasoned investor.
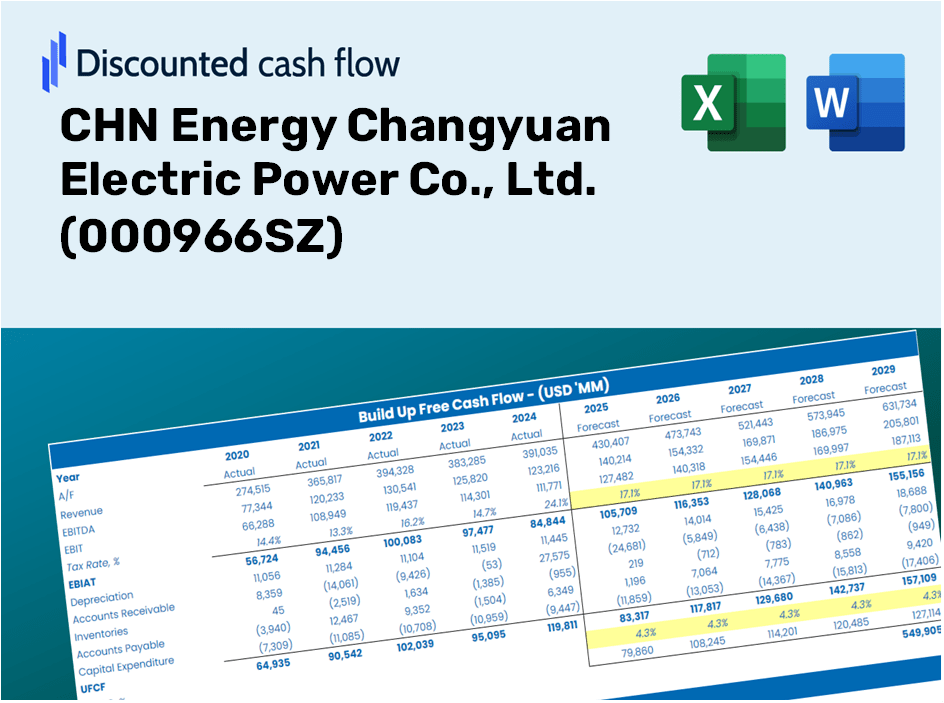
Discounted Cash Flow (DCF) - (USD MM)
| Year | AY1 2020 |
AY2 2021 |
AY3 2022 |
AY4 2023 |
AY5 2024 |
FY1 2025 |
FY2 2026 |
FY3 2027 |
FY4 2028 |
FY5 2029 |
|---|---|---|---|---|---|---|---|---|---|---|
| Revenue | 10,073.5 | 12,164.0 | 14,661.9 | 14,457.1 | 17,391.2 | 20,007.9 | 23,018.4 | 26,481.9 | 30,466.5 | 35,050.6 |
| Revenue Growth, % | 0 | 20.75 | 20.54 | -1.4 | 20.29 | 15.05 | 15.05 | 15.05 | 15.05 | 15.05 |
| EBITDA | 2,310.7 | 1,041.5 | 1,600.0 | 2,368.9 | 3,253.2 | 3,101.4 | 3,568.1 | 4,104.9 | 4,722.6 | 5,433.1 |
| EBITDA, % | 22.94 | 8.56 | 10.91 | 16.39 | 18.71 | 15.5 | 15.5 | 15.5 | 15.5 | 15.5 |
| Depreciation | 1,174.1 | 1,078.5 | 1,081.7 | 1,385.6 | 1,744.0 | 1,901.2 | 2,187.3 | 2,516.4 | 2,895.0 | 3,330.6 |
| Depreciation, % | 11.66 | 8.87 | 7.38 | 9.58 | 10.03 | 9.5 | 9.5 | 9.5 | 9.5 | 9.5 |
| EBIT | 1,136.6 | -37.1 | 518.3 | 983.4 | 1,509.2 | 1,200.2 | 1,380.8 | 1,588.5 | 1,827.5 | 2,102.5 |
| EBIT, % | 11.28 | -0.30465 | 3.53 | 6.8 | 8.68 | 6 | 6 | 6 | 6 | 6 |
| Total Cash | 123.7 | 1,084.2 | 285.1 | 607.0 | 230.5 | 704.7 | 810.7 | 932.7 | 1,073.0 | 1,234.5 |
| Total Cash, percent | .0 | .0 | .0 | .0 | .0 | .0 | .0 | .0 | .0 | .0 |
| Account Receivables | 1,217.8 | 1,470.4 | 2,172.8 | 2,058.5 | 2,337.6 | 2,668.1 | 3,069.6 | 3,531.5 | 4,062.8 | 4,674.1 |
| Account Receivables, % | 12.09 | 12.09 | 14.82 | 14.24 | 13.44 | 13.34 | 13.34 | 13.34 | 13.34 | 13.34 |
| Inventories | 88.9 | 849.0 | 566.8 | 725.9 | 953.4 | 889.6 | 1,023.4 | 1,177.4 | 1,354.6 | 1,558.4 |
| Inventories, % | 0.88266 | 6.98 | 3.87 | 5.02 | 5.48 | 4.45 | 4.45 | 4.45 | 4.45 | 4.45 |
| Accounts Payable | 938.0 | 2,054.7 | 671.4 | 1,286.6 | 2,498.3 | 2,162.8 | 2,488.2 | 2,862.6 | 3,293.3 | 3,788.8 |
| Accounts Payable, % | 9.31 | 16.89 | 4.58 | 8.9 | 14.37 | 10.81 | 10.81 | 10.81 | 10.81 | 10.81 |
| Capital Expenditure | -699.8 | -1,736.9 | -8,327.3 | -6,900.8 | -5,310.0 | -6,254.0 | -7,195.0 | -8,277.5 | -9,523.0 | -10,955.9 |
| Capital Expenditure, % | -6.95 | -14.28 | -56.8 | -47.73 | -30.53 | -31.26 | -31.26 | -31.26 | -31.26 | -31.26 |
| Tax Rate, % | 25.19 | 25.19 | 25.19 | 25.19 | 25.19 | 25.19 | 25.19 | 25.19 | 25.19 | 25.19 |
| EBITAT | 881.8 | -17.8 | 241.0 | 667.9 | 1,129.0 | 755.5 | 869.2 | 999.9 | 1,150.4 | 1,323.5 |
| Depreciation | ||||||||||
| Changes in Account Receivables | ||||||||||
| Changes in Inventories | ||||||||||
| Changes in Accounts Payable | ||||||||||
| Capital Expenditure | ||||||||||
| UFCF | 987.3 | -571.9 | -8,808.2 | -4,276.9 | -1,731.9 | -4,199.5 | -4,348.4 | -5,002.7 | -5,755.4 | -6,621.4 |
| WACC, % | 3.73 | 3.06 | 3.03 | 3.51 | 3.67 | 3.4 | 3.4 | 3.4 | 3.4 | 3.4 |
| PV UFCF | ||||||||||
| SUM PV UFCF | -23,290.6 | |||||||||
| Long Term Growth Rate, % | 3.40 | |||||||||
| Free cash flow (T + 1) | -6,847 | |||||||||
| Terminal Value | -4,990,633,080 | |||||||||
| Present Terminal Value | -4,222,309,517 | |||||||||
| Enterprise Value | -4,222,332,807 | |||||||||
| Net Debt | 20,306 | |||||||||
| Equity Value | -4,222,353,113 | |||||||||
| Diluted Shares Outstanding, MM | 2,810 | |||||||||
| Equity Value Per Share | -1,502,454.00 |
What You Will Receive
- Authentic CHN Energy Financial Data: Pre-filled with historical and projected data specific to CHN Energy Changyuan Electric Power Co., Ltd. for accurate analysis.
- Fully Customizable Template: Easily adjust key inputs such as revenue growth, WACC, and EBITDA percentage.
- Instant Calculations: Watch as the intrinsic value of CHN Energy updates in real-time based on your modifications.
- Professional Valuation Tool: Tailored for investors, analysts, and consultants in pursuit of reliable DCF outcomes.
- User-Friendly Interface: Intuitive layout and straightforward instructions suitable for all skill levels.
Key Features
- 🔍 Real-Life CHN Energy Financials: Pre-loaded historical and projected data for CHN Energy Changyuan Electric Power Co., Ltd. (000966SZ).
- ✏️ Fully Customizable Inputs: Tailor all essential parameters (yellow cells) such as WACC, growth %, and tax rates.
- 📊 Professional DCF Valuation: Integrated formulas evaluate CHN Energy’s intrinsic value via the Discounted Cash Flow method.
- ⚡ Instant Results: Immediately visualize CHN Energy’s valuation upon adjusting inputs.
- Scenario Analysis: Explore and compare various financial assumptions and outcomes side-by-side.
How It Functions
- Obtain the Template: Gain immediate access to the Excel-based CHN Energy DCF Calculator.
- Enter Your Inputs: Modify the yellow-highlighted cells for growth projections, WACC, profit margins, and other variables.
- Instantaneous Calculations: The model refreshes to reflect CHN Energy's intrinsic value automatically.
- Explore Scenarios: Test various assumptions to assess potential changes in valuation.
- Evaluate and Decide: Utilize the outcomes to inform your investment strategies or financial assessments.
Why Opt for Our Calculator?
- Precision: Utilizes real financial data from CHN Energy Changyuan Electric Power Co., Ltd. (000966SZ) for utmost accuracy.
- Versatility: Tailored for users to easily adjust and test various inputs.
- Efficiency: Eliminate the tedious process of creating a DCF model from the ground up.
- High-Quality Standards: Engineered with the level of detail and usability expected at a CFO's desk.
- Accessible: Simple to navigate, making it suitable for users without extensive financial modeling knowledge.
Who Can Benefit from This Product?
- Energy Sector Students: Master valuation methods and apply them to real-world data.
- Researchers: Utilize advanced models for academic projects or studies.
- Investors: Evaluate your investment hypotheses and analyze valuation results for CHN Energy Changyuan Electric Power Co., Ltd. (000966SZ).
- Financial Analysts: Enhance your efficiency with a ready-to-use, customizable DCF model.
- Small Business Entrepreneurs: Understand the analytical approaches used for large energy firms like CHN Energy Changyuan Electric Power Co., Ltd. (000966SZ).
Components of the Template
- Preloaded CHN Data: Historical and forecasted financial data including revenue, EBIT, and capital expenditures.
- DCF and WACC Models: Professional-grade sheets designed for determining intrinsic value and Weighted Average Cost of Capital.
- Editable Inputs: Yellow-highlighted cells for modifying revenue growth, tax rates, and discount rates.
- Financial Statements: Detailed annual and quarterly financials for in-depth analysis.
- Key Ratios: Profitability, leverage, and efficiency ratios for performance evaluation.
- Dashboard and Charts: Visual representations of valuation results and underlying assumptions.
Disclaimer
All information, articles, and product details provided on this website are for general informational and educational purposes only. We do not claim any ownership over, nor do we intend to infringe upon, any trademarks, copyrights, logos, brand names, or other intellectual property mentioned or depicted on this site. Such intellectual property remains the property of its respective owners, and any references here are made solely for identification or informational purposes, without implying any affiliation, endorsement, or partnership.
We make no representations or warranties, express or implied, regarding the accuracy, completeness, or suitability of any content or products presented. Nothing on this website should be construed as legal, tax, investment, financial, medical, or other professional advice. In addition, no part of this site—including articles or product references—constitutes a solicitation, recommendation, endorsement, advertisement, or offer to buy or sell any securities, franchises, or other financial instruments, particularly in jurisdictions where such activity would be unlawful.
All content is of a general nature and may not address the specific circumstances of any individual or entity. It is not a substitute for professional advice or services. Any actions you take based on the information provided here are strictly at your own risk. You accept full responsibility for any decisions or outcomes arising from your use of this website and agree to release us from any liability in connection with your use of, or reliance upon, the content or products found herein.