
|
شركة Shenzhen Techwinsemi Technology Co. ، Ltd. (001309.SZ) تقييم DCF |
Fully Editable: Tailor To Your Needs In Excel Or Sheets
Professional Design: Trusted, Industry-Standard Templates
Investor-Approved Valuation Models
MAC/PC Compatible, Fully Unlocked
No Expertise Is Needed; Easy To Follow
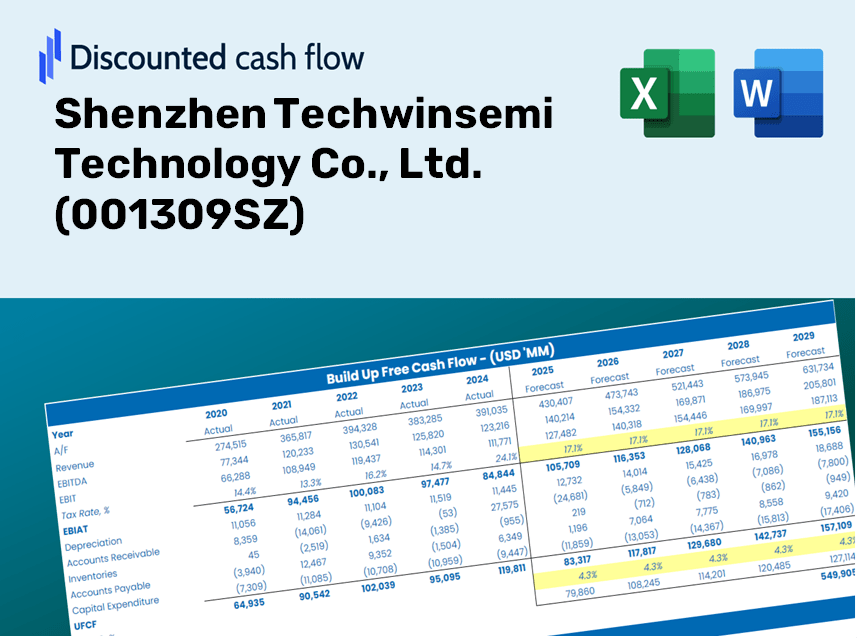
Shenzhen Techwinsemi Technology Co., Ltd. (001309.SZ) Bundle
Optimize your time and improve precision with our (001309SZ) DCF Calculator! Utilizing real Shenzhen Techwinsemi Technology Co., Ltd. data and customizable assumptions, this tool enables you to forecast, analyze, and value Shenzhen Techwinsemi Technology Co., Ltd. like a seasoned investor.
Discounted Cash Flow (DCF) - (USD MM)
| Year | AY1 2020 |
AY2 2021 |
AY3 2022 |
AY4 2023 |
AY5 2024 |
FY1 2025 |
FY2 2026 |
FY3 2027 |
FY4 2028 |
FY5 2029 |
|---|---|---|---|---|---|---|---|---|---|---|
| Revenue | 834.7 | 1,079.8 | 1,190.7 | 1,775.9 | 4,772.5 | 7,025.0 | 10,340.5 | 15,220.7 | 22,404.2 | 32,978.1 |
| Revenue Growth, % | 0 | 29.36 | 10.27 | 49.15 | 168.74 | 47.2 | 47.2 | 47.2 | 47.2 | 47.2 |
| EBITDA | 91.4 | 133.8 | 50.7 | 88.0 | 471.8 | 596.3 | 877.7 | 1,291.9 | 1,901.6 | 2,799.1 |
| EBITDA, % | 10.95 | 12.39 | 4.26 | 4.96 | 9.89 | 8.49 | 8.49 | 8.49 | 8.49 | 8.49 |
| Depreciation | 2.0 | 12.6 | 11.1 | 13.8 | 18.1 | 49.1 | 72.2 | 106.3 | 156.5 | 230.4 |
| Depreciation, % | 0.24318 | 1.16 | 0.92979 | 0.77731 | 0.37856 | 0.69864 | 0.69864 | 0.69864 | 0.69864 | 0.69864 |
| EBIT | 89.3 | 121.2 | 39.7 | 74.2 | 453.7 | 547.2 | 805.4 | 1,185.6 | 1,745.1 | 2,568.7 |
| EBIT, % | 10.7 | 11.23 | 3.33 | 4.18 | 9.51 | 7.79 | 7.79 | 7.79 | 7.79 | 7.79 |
| Total Cash | 72.0 | 117.6 | 249.5 | 274.4 | 915.9 | 1,055.3 | 1,553.4 | 2,286.5 | 3,365.6 | 4,954.0 |
| Total Cash, percent | .0 | .0 | .0 | .0 | .0 | .0 | .0 | .0 | .0 | .0 |
| Account Receivables | 126.4 | 156.9 | 426.9 | 448.0 | 443.6 | 1,405.8 | 2,069.2 | 3,045.8 | 4,483.3 | 6,599.2 |
| Account Receivables, % | 15.15 | 14.53 | 35.85 | 25.23 | 9.3 | 20.01 | 20.01 | 20.01 | 20.01 | 20.01 |
| Inventories | 437.4 | 565.5 | 755.4 | 1,932.0 | 4,436.4 | 5,074.6 | 7,469.6 | 10,995.0 | 16,184.2 | 23,822.4 |
| Inventories, % | 52.4 | 52.38 | 63.45 | 108.79 | 92.96 | 72.24 | 72.24 | 72.24 | 72.24 | 72.24 |
| Accounts Payable | 82.8 | 176.1 | 330.8 | 242.9 | 926.7 | 1,223.8 | 1,801.4 | 2,651.5 | 3,902.9 | 5,745.0 |
| Accounts Payable, % | 9.91 | 16.31 | 27.78 | 13.68 | 19.42 | 17.42 | 17.42 | 17.42 | 17.42 | 17.42 |
| Capital Expenditure | -80.1 | -57.1 | -122.3 | -102.2 | -123.7 | -470.8 | -692.9 | -1,020.0 | -1,501.4 | -2,210.0 |
| Capital Expenditure, % | -9.6 | -5.29 | -10.28 | -5.75 | -2.59 | -6.7 | -6.7 | -6.7 | -6.7 | -6.7 |
| Tax Rate, % | 7.42 | 7.42 | 7.42 | 7.42 | 7.42 | 7.42 | 7.42 | 7.42 | 7.42 | 7.42 |
| EBITAT | 74.7 | 108.1 | 40.8 | 122.7 | 420.0 | 509.2 | 749.6 | 1,103.4 | 1,624.1 | 2,390.6 |
| Depreciation | ||||||||||
| Changes in Account Receivables | ||||||||||
| Changes in Inventories | ||||||||||
| Changes in Accounts Payable | ||||||||||
| Capital Expenditure | ||||||||||
| UFCF | -484.5 | -1.7 | -375.6 | -1,251.2 | -1,501.8 | -1,215.7 | -2,352.0 | -3,462.1 | -5,096.0 | -7,501.1 |
| WACC, % | 10.84 | 10.85 | 10.88 | 10.88 | 10.86 | 10.86 | 10.86 | 10.86 | 10.86 | 10.86 |
| PV UFCF | ||||||||||
| SUM PV UFCF | -13,403.9 | |||||||||
| Long Term Growth Rate, % | 3.50 | |||||||||
| Free cash flow (T + 1) | -7,764 | |||||||||
| Terminal Value | -105,448 | |||||||||
| Present Terminal Value | -62,967 | |||||||||
| Enterprise Value | -76,371 | |||||||||
| Net Debt | 1,920 | |||||||||
| Equity Value | -78,290 | |||||||||
| Diluted Shares Outstanding, MM | 209 | |||||||||
| Equity Value Per Share | -374.88 |
What You Will Receive
- Authentic 001309SZ Financials: Access to historical and projected data for precise valuation.
- Customizable Parameters: Adjust WACC, tax rates, revenue growth, and capital expenditures to fit your analysis.
- Automated Calculations: Intrinsic value and NPV are calculated in real-time.
- Scenario Testing: Explore various scenarios to assess Shenzhen Techwinsemi's future prospects.
- User-Friendly Interface: Designed for industry experts while remaining accessible to newcomers.
Key Features
- Comprehensive DCF Calculator: Features detailed unlevered and levered DCF valuation models tailored for Shenzhen Techwinsemi Technology Co., Ltd. (001309SZ).
- WACC Calculator: Ready-to-use Weighted Average Cost of Capital template with customizable parameters.
- Modifiable Forecast Assumptions: Adjust growth projections, capital expenditures, and discount rates as needed.
- Integrated Financial Ratios: Evaluate profitability, leverage, and efficiency metrics specific to Shenzhen Techwinsemi Technology Co., Ltd. (001309SZ).
- Dynamic Dashboard and Charts: Visual representations that summarize essential valuation metrics for streamlined analysis.
How It Operates
- 1. Access the Template: Download and open the Excel file containing Shenzhen Techwinsemi Technology Co., Ltd.'s preloaded data.
- 2. Update Assumptions: Modify essential inputs such as growth projections, WACC, and capital expenditures.
- 3. Receive Instant Results: The DCF model automatically calculates intrinsic value and NPV.
- 4. Explore Different Scenarios: Evaluate various forecasts to assess different valuation possibilities.
- 5. Present with Confidence: Deliver professional valuation insights to validate your decisions for Shenzhen Techwinsemi Technology Co., Ltd. (001309SZ).
Why Opt for Shenzhen Techwinsemi Technology Co., Ltd. (001309SZ)?
- Time-Saving: Utilize our solutions without the hassle of starting from scratch.
- Enhanced Accuracy: Dependable data and methodologies minimize valuation mistakes.
- Completely Customizable: Adjust our offerings to align with your specific needs and forecasts.
- User-Friendly Insights: Intuitive graphs and outputs simplify result interpretation.
- Endorsed by Professionals: Crafted for experts who demand both accuracy and ease of use.
Who Can Benefit from This Product?
- Investors: Accurately assess the fair value of Shenzhen Techwinsemi Technology Co., Ltd. (001309SZ) before making investment choices.
- CFOs: Utilize a professional-grade DCF model for comprehensive financial reporting and analysis.
- Consultants: Seamlessly modify the template for valuation reports tailored to client needs.
- Entrepreneurs: Discover financial modeling techniques employed by leading companies in the industry.
- Educators: Employ this resource as a teaching aid to illustrate various valuation methodologies.
Contents of the Template
- Operating and Balance Sheet Data: Pre-filled historical data and forecasts for Shenzhen Techwinsemi Technology Co., Ltd. (001309SZ), including revenue, EBITDA, EBIT, and capital expenditures.
- WACC Calculation: A dedicated sheet for the Weighted Average Cost of Capital (WACC), featuring key parameters such as Beta, risk-free rate, and share price.
- DCF Valuation (Unlevered and Levered): Customizable Discounted Cash Flow models that demonstrate intrinsic value with comprehensive calculations.
- Financial Statements: Pre-loaded financial statements (both annual and quarterly) to facilitate detailed analysis.
- Key Ratios: Includes profitability, leverage, and efficiency ratios specific to Shenzhen Techwinsemi Technology Co., Ltd. (001309SZ).
- Dashboard and Charts: A visual overview of valuation outputs and assumptions to simplify result analysis.
Disclaimer
All information, articles, and product details provided on this website are for general informational and educational purposes only. We do not claim any ownership over, nor do we intend to infringe upon, any trademarks, copyrights, logos, brand names, or other intellectual property mentioned or depicted on this site. Such intellectual property remains the property of its respective owners, and any references here are made solely for identification or informational purposes, without implying any affiliation, endorsement, or partnership.
We make no representations or warranties, express or implied, regarding the accuracy, completeness, or suitability of any content or products presented. Nothing on this website should be construed as legal, tax, investment, financial, medical, or other professional advice. In addition, no part of this site—including articles or product references—constitutes a solicitation, recommendation, endorsement, advertisement, or offer to buy or sell any securities, franchises, or other financial instruments, particularly in jurisdictions where such activity would be unlawful.
All content is of a general nature and may not address the specific circumstances of any individual or entity. It is not a substitute for professional advice or services. Any actions you take based on the information provided here are strictly at your own risk. You accept full responsibility for any decisions or outcomes arising from your use of this website and agree to release us from any liability in connection with your use of, or reliance upon, the content or products found herein.