
|
China Merchants Port Group Co.، Ltd. (001872.SZ) تقييم DCF |
Fully Editable: Tailor To Your Needs In Excel Or Sheets
Professional Design: Trusted, Industry-Standard Templates
Investor-Approved Valuation Models
MAC/PC Compatible, Fully Unlocked
No Expertise Is Needed; Easy To Follow
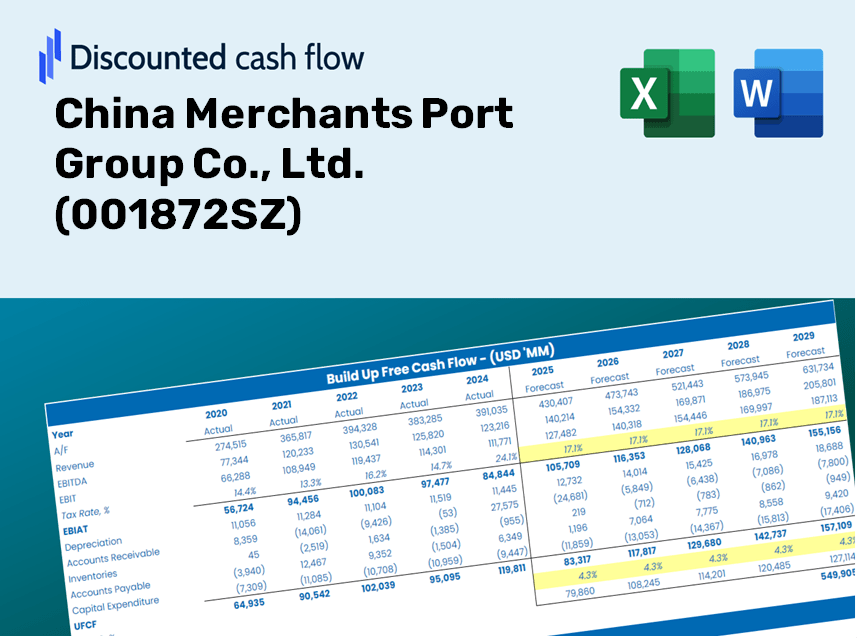
China Merchants Port Group Co., Ltd. (001872.SZ) Bundle
Whether you’re an investor or an analyst, this (001872SZ) DCF Calculator is your go-to resource for accurate valuation. Preloaded with data from China Merchants Port Group Co., Ltd., you can adjust forecasts and observe the effects in real time.
Discounted Cash Flow (DCF) - (USD MM)
| Year | AY1 2020 |
AY2 2021 |
AY3 2022 |
AY4 2023 |
AY5 2024 |
FY1 2025 |
FY2 2026 |
FY3 2027 |
FY4 2028 |
FY5 2029 |
|---|---|---|---|---|---|---|---|---|---|---|
| Revenue | 8,179.3 | 10,835.7 | 11,471.2 | 10,499.2 | 10,828.4 | 11,632.3 | 12,495.9 | 13,423.6 | 14,420.3 | 15,490.9 |
| Revenue Growth, % | 0 | 32.48 | 5.86 | -8.47 | 3.14 | 7.42 | 7.42 | 7.42 | 7.42 | 7.42 |
| EBITDA | 5,994.8 | 7,647.9 | 7,819.9 | 11,468.4 | 12,930.6 | 9,586.0 | 10,297.7 | 11,062.2 | 11,883.5 | 12,765.8 |
| EBITDA, % | 73.29 | 70.58 | 68.17 | 109.23 | 119.41 | 82.41 | 82.41 | 82.41 | 82.41 | 82.41 |
| Depreciation | 2,837.5 | 3,010.1 | 2,962.6 | 2,019.9 | 1,961.4 | 2,923.2 | 3,140.2 | 3,373.3 | 3,623.8 | 3,892.8 |
| Depreciation, % | 34.69 | 27.78 | 25.83 | 19.24 | 18.11 | 25.13 | 25.13 | 25.13 | 25.13 | 25.13 |
| EBIT | 3,157.3 | 4,637.9 | 4,857.3 | 9,448.5 | 10,969.2 | 7,299.0 | 7,840.9 | 8,423.0 | 9,048.4 | 9,720.2 |
| EBIT, % | 38.6 | 42.8 | 42.34 | 89.99 | 101.3 | 62.75 | 62.75 | 62.75 | 62.75 | 62.75 |
| Total Cash | 10,323.6 | 9,125.7 | 8,804.8 | 14,327.8 | 12,968.1 | 10,724.4 | 11,520.6 | 12,375.9 | 13,294.8 | 14,281.8 |
| Total Cash, percent | .0 | .0 | .0 | .0 | .0 | .0 | .0 | .0 | .0 | .0 |
| Account Receivables | 1,383.5 | 1,042.4 | 3,700.6 | 1,690.7 | 1,958.7 | 2,163.3 | 2,323.9 | 2,496.4 | 2,681.8 | 2,880.9 |
| Account Receivables, % | 16.91 | 9.62 | 32.26 | 16.1 | 18.09 | 18.6 | 18.6 | 18.6 | 18.6 | 18.6 |
| Inventories | 163.7 | 151.8 | 160.0 | 171.0 | 214.0 | 195.5 | 210.0 | 225.6 | 242.3 | 260.3 |
| Inventories, % | 2 | 1.4 | 1.39 | 1.63 | 1.98 | 1.68 | 1.68 | 1.68 | 1.68 | 1.68 |
| Accounts Payable | 285.3 | 499.3 | 434.3 | 328.3 | 338.3 | 421.9 | 453.2 | 486.8 | 523.0 | 561.8 |
| Accounts Payable, % | 3.49 | 4.61 | 3.79 | 3.13 | 3.12 | 3.63 | 3.63 | 3.63 | 3.63 | 3.63 |
| Capital Expenditure | -1,635.9 | -1,677.0 | -1,384.4 | -1,197.0 | -1,096.4 | -1,606.9 | -1,726.2 | -1,854.4 | -1,992.0 | -2,139.9 |
| Capital Expenditure, % | -20 | -15.48 | -12.07 | -11.4 | -10.12 | -13.81 | -13.81 | -13.81 | -13.81 | -13.81 |
| Tax Rate, % | 22.36 | 22.36 | 22.36 | 22.36 | 22.36 | 22.36 | 22.36 | 22.36 | 22.36 | 22.36 |
| EBITAT | 2,026.5 | 3,483.6 | 3,678.8 | 7,091.6 | 8,516.6 | 5,368.1 | 5,766.7 | 6,194.8 | 6,654.8 | 7,148.8 |
| Depreciation | ||||||||||
| Changes in Account Receivables | ||||||||||
| Changes in Inventories | ||||||||||
| Changes in Accounts Payable | ||||||||||
| Capital Expenditure | ||||||||||
| UFCF | 1,966.3 | 5,383.6 | 2,525.7 | 9,807.4 | 9,080.8 | 6,581.8 | 7,036.9 | 7,559.3 | 8,120.6 | 8,723.5 |
| WACC, % | 5.42 | 5.57 | 5.58 | 5.57 | 5.6 | 5.55 | 5.55 | 5.55 | 5.55 | 5.55 |
| PV UFCF | ||||||||||
| SUM PV UFCF | 32,183.4 | |||||||||
| Long Term Growth Rate, % | 2.00 | |||||||||
| Free cash flow (T + 1) | 8,898 | |||||||||
| Terminal Value | 250,752 | |||||||||
| Present Terminal Value | 191,419 | |||||||||
| Enterprise Value | 223,602 | |||||||||
| Net Debt | 21,157 | |||||||||
| Equity Value | 202,445 | |||||||||
| Diluted Shares Outstanding, MM | 4,198 | |||||||||
| Equity Value Per Share | 48.22 |
Benefits You Will Receive
- Pre-Filled Financial Model: Utilize China Merchants Port Group Co., Ltd.'s actual data for accurate DCF valuation.
- Comprehensive Forecast Control: Modify revenue growth, profit margins, WACC, and other critical parameters.
- Immediate Calculations: Real-time updates ensure you can view results instantly as you make adjustments.
- Professional-Grade Template: An expertly crafted Excel file, ideal for investor presentations and valuations.
- Flexible and Reusable: Designed with adaptability in mind, allowing for repeated use in detailed forecasts.
Key Features
- Pre-Loaded Data: Historical financial statements and pre-filled forecasts for China Merchants Port Group Co., Ltd. (001872SZ).
- Fully Adjustable Inputs: Customize WACC, tax rates, revenue growth, and EBITDA margins.
- Instant Results: View the intrinsic value of China Merchants Port Group Co., Ltd. (001872SZ) recalculated in real time.
- Clear Visual Outputs: Dashboard charts illustrate valuation outcomes and essential metrics.
- Built for Accuracy: A professional-grade tool designed for analysts, investors, and finance professionals.
How It Functions
- Download the Template: Gain immediate access to the Excel-based China Merchants Port Group Co., Ltd. (001872SZ) DCF Calculator.
- Enter Your Assumptions: Modify the cells highlighted in yellow for parameters like growth rates, WACC, profit margins, and more.
- Real-Time Calculations: The model automatically recalculates the intrinsic value of China Merchants Port Group Co., Ltd. (001872SZ).
- Explore Scenarios: Test various assumptions to see how they impact the valuation.
- Analyze and Decide: Leverage the results to inform your investment strategies or financial assessments.
Why Choose This Calculator for China Merchants Port Group Co., Ltd. (001872SZ)?
- Designed for Experts: A sophisticated tool favored by analysts, CFOs, and industry consultants.
- Accurate Financial Data: Historical and projected financials for China Merchants Port Group preloaded for precision.
- Scenario Analysis: Effortlessly test various forecasts and assumptions with our intuitive interface.
- Comprehensive Outputs: Instantly calculates intrinsic value, NPV, and essential financial metrics.
- User-Friendly Interface: Guided instructions ensure a smooth and straightforward experience.
Who Can Benefit from This Product?
- Finance Students: Master valuation methods and utilize them with actual financial data.
- Academics: Integrate industry-standard models into your teaching or research projects.
- Investors: Validate your investment theories and evaluate valuation scenarios for China Merchants Port Group Co., Ltd. (001872SZ).
- Analysts: Enhance your efficiency with a ready-to-use, customizable DCF model.
- Small Business Owners: Learn how major public companies like China Merchants Port Group Co., Ltd. (001872SZ) are appraised.
Contents of the Template
- Operating and Balance Sheet Data: Pre-filled historical data and forecasts for China Merchants Port Group Co., Ltd. (001872SZ), including metrics such as revenue, EBITDA, EBIT, and capital expenditures.
- WACC Calculation: A dedicated sheet for calculating the Weighted Average Cost of Capital (WACC), featuring parameters like Beta, risk-free rate, and share price.
- DCF Valuation (Unlevered and Levered): Customizable Discounted Cash Flow models illustrating intrinsic value with comprehensive calculations.
- Financial Statements: Pre-loaded annual and quarterly financial statements to facilitate thorough analysis.
- Key Ratios: Covers profitability, leverage, and efficiency ratios relevant to China Merchants Port Group Co., Ltd. (001872SZ).
- Dashboard and Charts: A visual summary of valuation outputs and underlying assumptions, designed for easy analysis of results.
Disclaimer
All information, articles, and product details provided on this website are for general informational and educational purposes only. We do not claim any ownership over, nor do we intend to infringe upon, any trademarks, copyrights, logos, brand names, or other intellectual property mentioned or depicted on this site. Such intellectual property remains the property of its respective owners, and any references here are made solely for identification or informational purposes, without implying any affiliation, endorsement, or partnership.
We make no representations or warranties, express or implied, regarding the accuracy, completeness, or suitability of any content or products presented. Nothing on this website should be construed as legal, tax, investment, financial, medical, or other professional advice. In addition, no part of this site—including articles or product references—constitutes a solicitation, recommendation, endorsement, advertisement, or offer to buy or sell any securities, franchises, or other financial instruments, particularly in jurisdictions where such activity would be unlawful.
All content is of a general nature and may not address the specific circumstances of any individual or entity. It is not a substitute for professional advice or services. Any actions you take based on the information provided here are strictly at your own risk. You accept full responsibility for any decisions or outcomes arising from your use of this website and agree to release us from any liability in connection with your use of, or reliance upon, the content or products found herein.