
|
شركة China Camc Engineering Co. ، Ltd. (002051.SZ) تقييم DCF |
Fully Editable: Tailor To Your Needs In Excel Or Sheets
Professional Design: Trusted, Industry-Standard Templates
Investor-Approved Valuation Models
MAC/PC Compatible, Fully Unlocked
No Expertise Is Needed; Easy To Follow
China CAMC Engineering Co., Ltd. (002051.SZ) Bundle
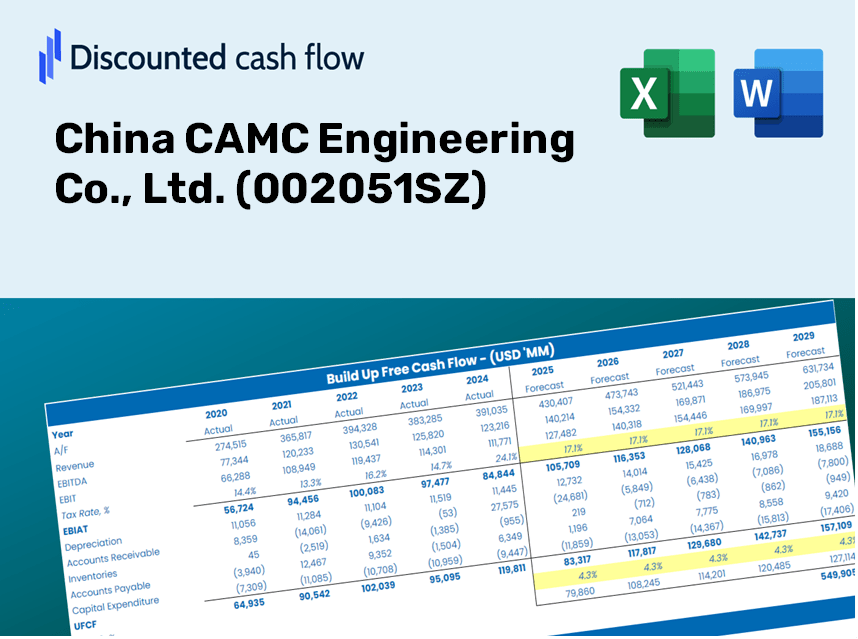
Designed for accuracy, our (002051SZ) DCF Calculator enables you to evaluate the valuation of China CAMC Engineering Co., Ltd. using real-world financial data and offers complete flexibility to modify all essential parameters for improved projections.
Discounted Cash Flow (DCF) - (USD MM)
| Year | AY1 2020 |
AY2 2021 |
AY3 2022 |
AY4 2023 |
AY5 2024 |
FY1 2025 |
FY2 2026 |
FY3 2027 |
FY4 2028 |
FY5 2029 |
|---|---|---|---|---|---|---|---|---|---|---|
| Revenue | 7,966.0 | 8,639.8 | 9,717.2 | 12,365.4 | 12,208.0 | 13,639.7 | 15,239.2 | 17,026.4 | 19,023.1 | 21,253.9 |
| Revenue Growth, % | 0 | 8.46 | 12.47 | 27.25 | -1.27 | 11.73 | 11.73 | 11.73 | 11.73 | 11.73 |
| EBITDA | 445.7 | 336.9 | 128.5 | 664.6 | 520.0 | 557.9 | 623.3 | 696.4 | 778.1 | 869.3 |
| EBITDA, % | 5.6 | 3.9 | 1.32 | 5.37 | 4.26 | 4.09 | 4.09 | 4.09 | 4.09 | 4.09 |
| Depreciation | 220.3 | 173.3 | 144.6 | 154.5 | 146.3 | 237.6 | 265.4 | 296.5 | 331.3 | 370.2 |
| Depreciation, % | 2.77 | 2.01 | 1.49 | 1.25 | 1.2 | 1.74 | 1.74 | 1.74 | 1.74 | 1.74 |
| EBIT | 225.4 | 163.6 | -16.2 | 510.1 | 373.6 | 320.3 | 357.9 | 399.9 | 446.7 | 499.1 |
| EBIT, % | 2.83 | 1.89 | -0.16629 | 4.13 | 3.06 | 2.35 | 2.35 | 2.35 | 2.35 | 2.35 |
| Total Cash | 8,157.2 | 7,149.2 | 7,127.7 | 7,055.3 | 6,265.6 | 9,942.8 | 11,108.8 | 12,411.5 | 13,867.0 | 15,493.2 |
| Total Cash, percent | .0 | .0 | .0 | .0 | .0 | .0 | .0 | .0 | .0 | .0 |
| Account Receivables | 4,518.1 | 5,069.0 | 4,850.7 | 6,195.7 | 6,291.8 | 7,282.2 | 8,136.2 | 9,090.4 | 10,156.4 | 11,347.5 |
| Account Receivables, % | 56.72 | 58.67 | 49.92 | 50.11 | 51.54 | 53.39 | 53.39 | 53.39 | 53.39 | 53.39 |
| Inventories | 3,983.1 | 4,656.6 | 3,847.6 | 3,450.4 | 3,319.0 | 5,417.3 | 6,052.6 | 6,762.4 | 7,555.4 | 8,441.4 |
| Inventories, % | 50 | 53.9 | 39.6 | 27.9 | 27.19 | 39.72 | 39.72 | 39.72 | 39.72 | 39.72 |
| Accounts Payable | 4,338.6 | 4,467.2 | 4,387.4 | 5,283.4 | 5,237.5 | 6,463.8 | 7,221.8 | 8,068.7 | 9,015.0 | 10,072.2 |
| Accounts Payable, % | 54.46 | 51.71 | 45.15 | 42.73 | 42.9 | 47.39 | 47.39 | 47.39 | 47.39 | 47.39 |
| Capital Expenditure | -81.4 | -174.4 | -287.6 | -94.1 | -700.3 | -340.9 | -380.9 | -425.6 | -475.5 | -531.2 |
| Capital Expenditure, % | -1.02 | -2.02 | -2.96 | -0.76104 | -5.74 | -2.5 | -2.5 | -2.5 | -2.5 | -2.5 |
| Tax Rate, % | 30.59 | 30.59 | 30.59 | 30.59 | 30.59 | 30.59 | 30.59 | 30.59 | 30.59 | 30.59 |
| EBITAT | 189.8 | 165.4 | -11.5 | 346.6 | 259.3 | 251.7 | 281.3 | 314.2 | 351.1 | 392.3 |
| Depreciation | ||||||||||
| Changes in Account Receivables | ||||||||||
| Changes in Inventories | ||||||||||
| Changes in Accounts Payable | ||||||||||
| Capital Expenditure | ||||||||||
| UFCF | -3,833.9 | -931.5 | 793.0 | 355.2 | -305.2 | -1,714.1 | -565.5 | -631.8 | -705.9 | -788.7 |
| WACC, % | 5.09 | 5.23 | 4.98 | 4.95 | 4.96 | 5.04 | 5.04 | 5.04 | 5.04 | 5.04 |
| PV UFCF | ||||||||||
| SUM PV UFCF | -3,885.7 | |||||||||
| Long Term Growth Rate, % | 2.00 | |||||||||
| Free cash flow (T + 1) | -804 | |||||||||
| Terminal Value | -26,425 | |||||||||
| Present Terminal Value | -20,661 | |||||||||
| Enterprise Value | -24,547 | |||||||||
| Net Debt | -4,137 | |||||||||
| Equity Value | -20,410 | |||||||||
| Diluted Shares Outstanding, MM | 1,246 | |||||||||
| Equity Value Per Share | -16.38 |
What You Will Receive
- Authentic CAMC Financial Data: Access to historical and projected figures for precise valuation.
- Customizable Variables: Adjust WACC, tax rates, revenue growth rates, and capital expenditures.
- Real-Time Calculations: Dynamic computation of intrinsic value and NPV.
- Scenario Evaluation: Analyze various scenarios to assess the future outlook of CAMC Engineering.
- User-Friendly Design: Designed for industry professionals while remaining accessible for newcomers.
Key Features
- 🔍 Real-Life CAMC Financials: Pre-filled historical and projected data for China CAMC Engineering Co., Ltd. (002051SZ).
- ✏️ Fully Customizable Inputs: Adjust all critical parameters (yellow cells) including WACC, growth %, and tax rates.
- 📊 Professional DCF Valuation: Built-in formulas calculate CAMC’s intrinsic value using the Discounted Cash Flow method.
- ⚡ Instant Results: Visualize CAMC’s valuation instantly after making adjustments.
- Scenario Analysis: Test and compare outcomes for various financial assumptions side-by-side.
How It Works
- Step 1: Download the Excel file for China CAMC Engineering Co., Ltd. (002051SZ).
- Step 2: Review the pre-filled data on historical and projected performance.
- Step 3: Modify key assumptions (highlighted in yellow) according to your analysis.
- Step 4: Observe the automatic recalculations reflecting the intrinsic value of China CAMC Engineering Co., Ltd. (002051SZ).
- Step 5: Utilize the results for your investment strategies or reporting requirements.
Why Opt for China CAMC Engineering Co., Ltd. ([002051SZ])?
- Time Efficient: Skip the hassle of building complex financial models – our solutions are ready for immediate use.
- Enhanced Precision: Dependable financial data and validated formulas minimize valuation inaccuracies.
- Completely Customizable: Adjust the model to align with your specific assumptions and forecasts.
- User-Friendly: Intuitive charts and outputs simplify result analysis.
- Endorsed by Professionals: Crafted for experts who prioritize accuracy and functionality.
Who Can Benefit from This Product?
- Engineering Students: Explore project management techniques and apply them using real-world scenarios.
- Researchers: Integrate industry-standard models into your academic studies or published papers.
- Investors: Validate your investment strategies and evaluate valuation projections for China CAMC Engineering Co., Ltd. (002051SZ).
- Market Analysts: Optimize your analysis process with a customizable financial model tailored for engineering firms.
- Entrepreneurs: Discover how large engineering corporations like China CAMC Engineering Co., Ltd. (002051SZ) approach market analysis.
What the Template Includes
- Operating and Balance Sheet Data: Pre-filled historical data and forecasts for China CAMC Engineering Co., Ltd. (002051SZ), covering revenue, EBITDA, EBIT, and capital expenditures.
- WACC Calculation: A dedicated sheet for calculating the Weighted Average Cost of Capital (WACC), featuring key parameters such as Beta, risk-free rate, and share price.
- DCF Valuation (Unlevered and Levered): Customizable Discounted Cash Flow models that detail intrinsic value with comprehensive calculations.
- Financial Statements: Pre-loaded financial statements (both annual and quarterly) to facilitate thorough analysis.
- Key Ratios: A collection of profitability, leverage, and efficiency ratios specific to China CAMC Engineering Co., Ltd. (002051SZ).
- Dashboard and Charts: A visual overview of valuation outputs and assumptions for streamlined result analysis.
Disclaimer
All information, articles, and product details provided on this website are for general informational and educational purposes only. We do not claim any ownership over, nor do we intend to infringe upon, any trademarks, copyrights, logos, brand names, or other intellectual property mentioned or depicted on this site. Such intellectual property remains the property of its respective owners, and any references here are made solely for identification or informational purposes, without implying any affiliation, endorsement, or partnership.
We make no representations or warranties, express or implied, regarding the accuracy, completeness, or suitability of any content or products presented. Nothing on this website should be construed as legal, tax, investment, financial, medical, or other professional advice. In addition, no part of this site—including articles or product references—constitutes a solicitation, recommendation, endorsement, advertisement, or offer to buy or sell any securities, franchises, or other financial instruments, particularly in jurisdictions where such activity would be unlawful.
All content is of a general nature and may not address the specific circumstances of any individual or entity. It is not a substitute for professional advice or services. Any actions you take based on the information provided here are strictly at your own risk. You accept full responsibility for any decisions or outcomes arising from your use of this website and agree to release us from any liability in connection with your use of, or reliance upon, the content or products found herein.