
|
شركة Yunnan Energy Investment Co.، Ltd. (002053.SZ) تقييم DCF |
Fully Editable: Tailor To Your Needs In Excel Or Sheets
Professional Design: Trusted, Industry-Standard Templates
Investor-Approved Valuation Models
MAC/PC Compatible, Fully Unlocked
No Expertise Is Needed; Easy To Follow
Yunnan Energy Investment Co., Ltd. (002053.SZ) Bundle
Designed for accuracy, our (002053SZ) DCF Calculator enables you to evaluate Yunnan Energy Investment Co., Ltd. valuation using real-world financial data, along with the flexibility to modify all essential parameters for enhanced projections.
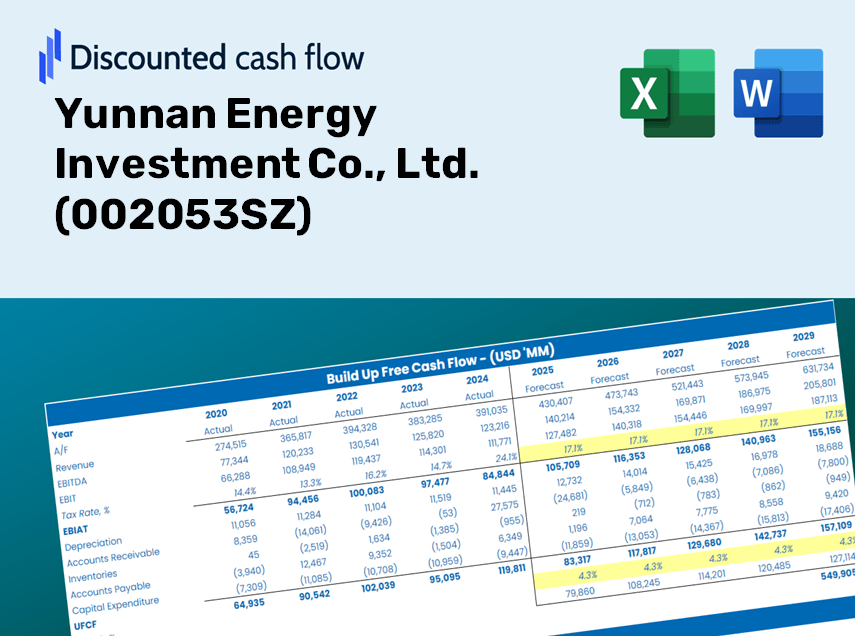
Discounted Cash Flow (DCF) - (USD MM)
| Year | AY1 2020 |
AY2 2021 |
AY3 2022 |
AY4 2023 |
AY5 2024 |
FY1 2025 |
FY2 2026 |
FY3 2027 |
FY4 2028 |
FY5 2029 |
|---|---|---|---|---|---|---|---|---|---|---|
| Revenue | 1,990.3 | 2,348.0 | 2,677.3 | 2,904.1 | 3,453.0 | 3,965.6 | 4,554.2 | 5,230.2 | 6,006.5 | 6,898.0 |
| Revenue Growth, % | 0 | 17.97 | 14.02 | 8.47 | 18.9 | 14.84 | 14.84 | 14.84 | 14.84 | 14.84 |
| EBITDA | 632.3 | 664.1 | 763.2 | 887.8 | 1,302.7 | 1,244.1 | 1,428.7 | 1,640.8 | 1,884.3 | 2,164.0 |
| EBITDA, % | 31.77 | 28.28 | 28.51 | 30.57 | 37.73 | 31.37 | 31.37 | 31.37 | 31.37 | 31.37 |
| Depreciation | 287.6 | 299.5 | 333.1 | 372.1 | 500.9 | 531.1 | 610.0 | 700.5 | 804.5 | 923.9 |
| Depreciation, % | 14.45 | 12.76 | 12.44 | 12.81 | 14.51 | 13.39 | 13.39 | 13.39 | 13.39 | 13.39 |
| EBIT | 344.7 | 364.6 | 430.1 | 515.6 | 801.8 | 712.9 | 818.7 | 940.3 | 1,079.8 | 1,240.1 |
| EBIT, % | 17.32 | 15.53 | 16.07 | 17.75 | 23.22 | 17.98 | 17.98 | 17.98 | 17.98 | 17.98 |
| Total Cash | 1,380.3 | 1,146.1 | 2,899.6 | 2,442.6 | 2,491.5 | 2,969.6 | 3,410.4 | 3,916.6 | 4,498.0 | 5,165.6 |
| Total Cash, percent | .0 | .0 | .0 | .0 | .0 | .0 | .0 | .0 | .0 | .0 |
| Account Receivables | 1,019.9 | 1,220.2 | 1,396.0 | 1,552.3 | 1,702.6 | 2,047.2 | 2,351.0 | 2,700.0 | 3,100.7 | 3,561.0 |
| Account Receivables, % | 51.24 | 51.97 | 52.14 | 53.45 | 49.31 | 51.62 | 51.62 | 51.62 | 51.62 | 51.62 |
| Inventories | 89.1 | 87.0 | 98.9 | 93.4 | 162.6 | 157.0 | 180.3 | 207.1 | 237.9 | 273.2 |
| Inventories, % | 4.48 | 3.71 | 3.69 | 3.22 | 4.71 | 3.96 | 3.96 | 3.96 | 3.96 | 3.96 |
| Accounts Payable | 599.6 | 561.5 | 652.1 | 1,469.6 | 1,379.7 | 1,340.0 | 1,538.9 | 1,767.3 | 2,029.6 | 2,330.9 |
| Accounts Payable, % | 30.13 | 23.91 | 24.36 | 50.6 | 39.96 | 33.79 | 33.79 | 33.79 | 33.79 | 33.79 |
| Capital Expenditure | -572.2 | -612.3 | -2,040.3 | -3,539.1 | -1,695.7 | -2,221.8 | -2,551.6 | -2,930.4 | -3,365.3 | -3,864.8 |
| Capital Expenditure, % | -28.75 | -26.08 | -76.21 | -121.87 | -49.11 | -56.03 | -56.03 | -56.03 | -56.03 | -56.03 |
| Tax Rate, % | 0.75543 | 0.75543 | 0.75543 | 0.75543 | 0.75543 | 0.75543 | 0.75543 | 0.75543 | 0.75543 | 0.75543 |
| EBITAT | 256.2 | 284.8 | 364.0 | 511.5 | 795.7 | 621.0 | 713.1 | 819.0 | 940.5 | 1,080.1 |
| Depreciation | ||||||||||
| Changes in Account Receivables | ||||||||||
| Changes in Inventories | ||||||||||
| Changes in Accounts Payable | ||||||||||
| Capital Expenditure | ||||||||||
| UFCF | -537.8 | -264.4 | -1,440.2 | -1,988.8 | -708.5 | -1,448.4 | -1,356.8 | -1,558.2 | -1,789.5 | -2,055.1 |
| WACC, % | 4.49 | 4.55 | 4.64 | 4.85 | 4.85 | 4.68 | 4.68 | 4.68 | 4.68 | 4.68 |
| PV UFCF | ||||||||||
| SUM PV UFCF | -7,106.0 | |||||||||
| Long Term Growth Rate, % | 4.00 | |||||||||
| Free cash flow (T + 1) | -2,137 | |||||||||
| Terminal Value | -315,132 | |||||||||
| Present Terminal Value | -250,733 | |||||||||
| Enterprise Value | -257,839 | |||||||||
| Net Debt | 5,061 | |||||||||
| Equity Value | -262,900 | |||||||||
| Diluted Shares Outstanding, MM | 921 | |||||||||
| Equity Value Per Share | -285.53 |
Benefits You Will Receive
- Genuine Yunnan Energy Financials (002053SZ): Access to historical and projected data for precise valuation.
- Customizable Parameters: Adjust WACC, tax rates, revenue growth, and capital spending according to your needs.
- Real-Time Calculations: Automatically computes intrinsic value and NPV for your convenience.
- Scenario Testing: Explore various scenarios to assess Yunnan Energy's future performance.
- User-Friendly Design: Designed for professionals while remaining easy to use for newcomers.
Key Features of Yunnan Energy Investment Co., Ltd. (002053SZ)
- Authentic Financial Data: Gain access to reliable historical data and future forecasts tailored for Yunnan Energy.
- Adjustable Forecast Parameters: Modify highlighted cells for WACC, growth projections, and profit margins to suit your analysis.
- Real-Time Calculations: Automatic updates for DCF, Net Present Value (NPV), and cash flow evaluations.
- User-Friendly Dashboard: Intuitive charts and summaries that make visualizing your valuation straightforward.
- Suitable for All Skill Levels: Designed with a simple layout, ideal for investors, CFOs, and consultants alike.
How It Functions
- Download: Obtain the ready-to-use Excel file featuring Yunnan Energy Investment Co., Ltd.'s (002053SZ) financial data.
- Customize: Modify forecasts, such as revenue growth, EBITDA %, and WACC to suit your analysis.
- Update Automatically: Watch as the intrinsic value and NPV calculations refresh in real-time.
- Test Scenarios: Generate multiple projections and instantly compare results.
- Make Decisions: Leverage the valuation insights to refine your investment approach.
Why Choose This Calculator for Yunnan Energy Investment Co., Ltd. (002053SZ)?
- Reliable Data: Utilize authentic financial information from Yunnan Energy for accurate valuation outcomes.
- Tailored Options: Modify essential variables such as growth projections, WACC, and tax rates to align with your financial forecasts.
- Efficient: Pre-existing calculations save you the effort of starting from the ground up.
- Professional Quality: Crafted for investors, analysts, and financial consultants.
- User-Friendly Design: Simple interface and clear step-by-step guidance make it accessible for all users.
Who Can Benefit from This Product?
- Energy Sector Students: Explore energy valuation methodologies and practice with actual market data.
- Researchers: Integrate industry models into academic studies or projects.
- Investors: Validate your theories and assess valuation scenarios for Yunnan Energy Investment Co., Ltd. (002053SZ).
- Financial Analysts: Enhance your productivity with a tailor-made, ready-to-use DCF model.
- Entrepreneurs: Discover how major public energy companies like Yunnan Energy Investment Co., Ltd. (002053SZ) are evaluated.
Contents of the Template
- Preloaded Yunnan Energy Data: Historical and projected financial figures, including revenue, EBIT, and capital expenditures.
- DCF and WACC Models: Professional templates designed for calculating intrinsic value and Weighted Average Cost of Capital.
- Customizable Inputs: Yellow-highlighted fields for modifying revenue growth, tax rates, and discount rates.
- Financial Statements: Detailed annual and quarterly financial reports for extensive analysis.
- Key Ratios: Profitability, leverage, and efficiency metrics to assess performance.
- Dashboard and Visualizations: Graphical representations of valuation results and underlying assumptions.
Disclaimer
All information, articles, and product details provided on this website are for general informational and educational purposes only. We do not claim any ownership over, nor do we intend to infringe upon, any trademarks, copyrights, logos, brand names, or other intellectual property mentioned or depicted on this site. Such intellectual property remains the property of its respective owners, and any references here are made solely for identification or informational purposes, without implying any affiliation, endorsement, or partnership.
We make no representations or warranties, express or implied, regarding the accuracy, completeness, or suitability of any content or products presented. Nothing on this website should be construed as legal, tax, investment, financial, medical, or other professional advice. In addition, no part of this site—including articles or product references—constitutes a solicitation, recommendation, endorsement, advertisement, or offer to buy or sell any securities, franchises, or other financial instruments, particularly in jurisdictions where such activity would be unlawful.
All content is of a general nature and may not address the specific circumstances of any individual or entity. It is not a substitute for professional advice or services. Any actions you take based on the information provided here are strictly at your own risk. You accept full responsibility for any decisions or outcomes arising from your use of this website and agree to release us from any liability in connection with your use of, or reliance upon, the content or products found herein.