
|
شركة Jiangsu Dagang Co.، Ltd. (002077.SZ) تقييم DCF |
Fully Editable: Tailor To Your Needs In Excel Or Sheets
Professional Design: Trusted, Industry-Standard Templates
Investor-Approved Valuation Models
MAC/PC Compatible, Fully Unlocked
No Expertise Is Needed; Easy To Follow
Jiangsu Dagang Co., Ltd. (002077.SZ) Bundle
Explore the financial prospects of Jiangsu Dagang Co., Ltd. (002077SZ) using our user-friendly DCF Calculator! Enter your assumptions regarding growth, margins, and costs to determine the intrinsic value of Jiangsu Dagang Co., Ltd. (002077SZ) and refine your investment strategy.
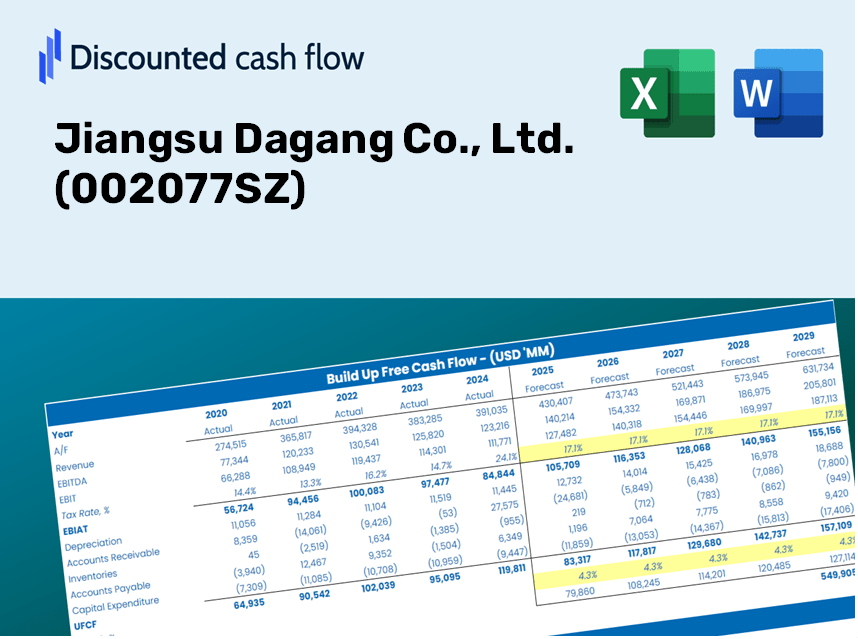
Discounted Cash Flow (DCF) - (USD MM)
| Year | AY1 2020 |
AY2 2021 |
AY3 2022 |
AY4 2023 |
AY5 2024 |
FY1 2025 |
FY2 2026 |
FY3 2027 |
FY4 2028 |
FY5 2029 |
|---|---|---|---|---|---|---|---|---|---|---|
| Revenue | 860.3 | 683.6 | 569.3 | 421.0 | 336.3 | 266.2 | 210.6 | 166.7 | 131.9 | 104.4 |
| Revenue Growth, % | 0 | -20.54 | -16.73 | -26.05 | -20.11 | -20.86 | -20.86 | -20.86 | -20.86 | -20.86 |
| EBITDA | 272.2 | 176.7 | 130.7 | 71.1 | 123.5 | 71.4 | 56.5 | 44.7 | 35.4 | 28.0 |
| EBITDA, % | 31.64 | 25.85 | 22.95 | 16.89 | 36.72 | 26.81 | 26.81 | 26.81 | 26.81 | 26.81 |
| Depreciation | 113.8 | 134.7 | 142.3 | 117.2 | 120.1 | 64.7 | 51.2 | 40.5 | 32.1 | 25.4 |
| Depreciation, % | 13.23 | 19.7 | 24.99 | 27.85 | 35.71 | 24.3 | 24.3 | 24.3 | 24.3 | 24.3 |
| EBIT | 158.4 | 42.0 | -11.6 | -46.2 | 3.4 | 6.7 | 5.3 | 4.2 | 3.3 | 2.6 |
| EBIT, % | 18.41 | 6.14 | -2.04 | -10.96 | 1.01 | 2.51 | 2.51 | 2.51 | 2.51 | 2.51 |
| Total Cash | 422.6 | 573.3 | 398.9 | 278.6 | 263.0 | 184.9 | 146.4 | 115.8 | 91.7 | 72.6 |
| Total Cash, percent | .0 | .0 | .0 | .0 | .0 | .0 | .0 | .0 | .0 | .0 |
| Account Receivables | 437.3 | 200.9 | 248.9 | 135.8 | 101.9 | 99.3 | 78.6 | 62.2 | 49.2 | 38.9 |
| Account Receivables, % | 50.83 | 29.38 | 43.72 | 32.26 | 30.3 | 37.3 | 37.3 | 37.3 | 37.3 | 37.3 |
| Inventories | 231.2 | 235.2 | 227.6 | 219.5 | 191.9 | 112.0 | 88.7 | 70.2 | 55.5 | 43.9 |
| Inventories, % | 26.87 | 34.4 | 39.98 | 52.14 | 57.06 | 42.09 | 42.09 | 42.09 | 42.09 | 42.09 |
| Accounts Payable | 264.3 | 242.9 | 213.0 | 206.2 | 168.9 | 108.0 | 85.5 | 67.6 | 53.5 | 42.4 |
| Accounts Payable, % | 30.72 | 35.53 | 37.42 | 48.98 | 50.21 | 40.57 | 40.57 | 40.57 | 40.57 | 40.57 |
| Capital Expenditure | -85.2 | -126.6 | -178.6 | -109.3 | -51.4 | -53.8 | -42.6 | -33.7 | -26.7 | -21.1 |
| Capital Expenditure, % | -9.91 | -18.52 | -31.38 | -25.96 | -15.29 | -20.21 | -20.21 | -20.21 | -20.21 | -20.21 |
| Tax Rate, % | 30.21 | 30.21 | 30.21 | 30.21 | 30.21 | 30.21 | 30.21 | 30.21 | 30.21 | 30.21 |
| EBITAT | 116.2 | 34.8 | -11.4 | -45.2 | 2.4 | 5.6 | 4.5 | 3.5 | 2.8 | 2.2 |
| Depreciation | ||||||||||
| Changes in Account Receivables | ||||||||||
| Changes in Inventories | ||||||||||
| Changes in Accounts Payable | ||||||||||
| Capital Expenditure | ||||||||||
| UFCF | -259.4 | 253.9 | -118.1 | 77.1 | 95.2 | 38.1 | 34.6 | 27.4 | 21.7 | 17.2 |
| WACC, % | 4.93 | 4.96 | 5 | 5 | 4.92 | 4.96 | 4.96 | 4.96 | 4.96 | 4.96 |
| PV UFCF | ||||||||||
| SUM PV UFCF | 122.8 | |||||||||
| Long Term Growth Rate, % | 4.00 | |||||||||
| Free cash flow (T + 1) | 18 | |||||||||
| Terminal Value | 1,860 | |||||||||
| Present Terminal Value | 1,461 | |||||||||
| Enterprise Value | 1,583 | |||||||||
| Net Debt | 179 | |||||||||
| Equity Value | 1,405 | |||||||||
| Diluted Shares Outstanding, MM | 591 | |||||||||
| Equity Value Per Share | 2.38 |
What You Will Receive
- Pre-Configured Financial Model: Utilize Jiangsu Dagang Co., Ltd.'s ([002077SZ]) actual data for accurate DCF valuation.
- Comprehensive Forecast Control: Modify revenue growth, profit margins, WACC, and other essential variables.
- Real-Time Calculations: Automatic updates provide immediate insights as adjustments are made.
- Professional-Grade Template: A polished Excel file crafted for high-quality valuation analysis.
- Flexible and Reusable: Designed for adaptability, allowing repeated application for in-depth forecasting.
Key Features
- Comprehensive Historical Data: Pre-loaded with Jiangsu Dagang Co., Ltd.'s financial history and future forecasts.
- Customizable Parameters: Tailor revenue growth, profit margins, discount rates, tax implications, and capital expenditure assumptions.
- Interactive Valuation Model: Automatic recalculations of Net Present Value (NPV) and intrinsic value based on your adjustments.
- Scenario Analysis: Generate various forecasting scenarios to explore different valuation possibilities.
- Intuitive Interface: Designed for ease of use, making it accessible for both experienced professionals and newcomers.
Process Overview
- Step 1: Download the Excel spreadsheet.
- Step 2: Examine the pre-filled data for Jiangsu Dagang Co., Ltd. (002077SZ) including historical and forecasted figures.
- Step 3: Modify key assumptions (highlighted in yellow) based on your analysis.
- Step 4: Observe the automatic recalculations reflecting the intrinsic value of Jiangsu Dagang Co., Ltd. (002077SZ).
- Step 5: Leverage the results for your investment strategies or reporting needs.
Why Opt for This Calculator?
- Reliable Data: Authentic Jiangsu Dagang Co., Ltd. financials provide trustworthy valuation outcomes.
- Tailorable: Modify essential variables such as growth rates, WACC, and tax rates to align with your forecasts.
- Efficiency Boost: Pre-configured calculations allow you to skip the initial setup.
- Expert-Level Tool: Crafted for investors, analysts, and consultants alike.
- Accessible Interface: User-friendly design with clear guidance ensures ease of use for everyone.
Who Can Benefit from This Product?
- Institutional Investors: Develop in-depth and accurate valuation models for investment assessments in Jiangsu Dagang Co., Ltd. (002077SZ).
- Corporate Finance Professionals: Evaluate valuation scenarios to inform strategic decisions within their organizations.
- Financial Consultants: Deliver precise valuation analysis for clients interested in Jiangsu Dagang Co., Ltd. (002077SZ).
- Students and Academic Instructors: Utilize real-time data to enhance learning and apply financial modeling techniques.
- Industry Analysts: Gain insights into how companies like Jiangsu Dagang Co., Ltd. (002077SZ) are assessed within the market landscape.
Contents of the Template
- Comprehensive DCF Model: An editable template featuring intricate valuation calculations.
- Real-World Data: Preloaded historical and projected financials for Jiangsu Dagang Co., Ltd. (002077SZ) to facilitate analysis.
- Customizable Parameters: Modify WACC, growth rates, and tax assumptions to explore various scenarios.
- Financial Statements: Complete annual and quarterly reports for in-depth insights.
- Key Ratios: Integrated analysis covering profitability, efficiency, and leverage metrics.
- Dashboard with Visual Outputs: Graphs and tables that present clear, actionable results.
Disclaimer
All information, articles, and product details provided on this website are for general informational and educational purposes only. We do not claim any ownership over, nor do we intend to infringe upon, any trademarks, copyrights, logos, brand names, or other intellectual property mentioned or depicted on this site. Such intellectual property remains the property of its respective owners, and any references here are made solely for identification or informational purposes, without implying any affiliation, endorsement, or partnership.
We make no representations or warranties, express or implied, regarding the accuracy, completeness, or suitability of any content or products presented. Nothing on this website should be construed as legal, tax, investment, financial, medical, or other professional advice. In addition, no part of this site—including articles or product references—constitutes a solicitation, recommendation, endorsement, advertisement, or offer to buy or sell any securities, franchises, or other financial instruments, particularly in jurisdictions where such activity would be unlawful.
All content is of a general nature and may not address the specific circumstances of any individual or entity. It is not a substitute for professional advice or services. Any actions you take based on the information provided here are strictly at your own risk. You accept full responsibility for any decisions or outcomes arising from your use of this website and agree to release us from any liability in connection with your use of, or reliance upon, the content or products found herein.