
|
TECON BIOLOGY Co .LTD (002100.SZ) تقييم DCF |
Fully Editable: Tailor To Your Needs In Excel Or Sheets
Professional Design: Trusted, Industry-Standard Templates
Investor-Approved Valuation Models
MAC/PC Compatible, Fully Unlocked
No Expertise Is Needed; Easy To Follow
TECON BIOLOGY Co.LTD (002100.SZ) Bundle
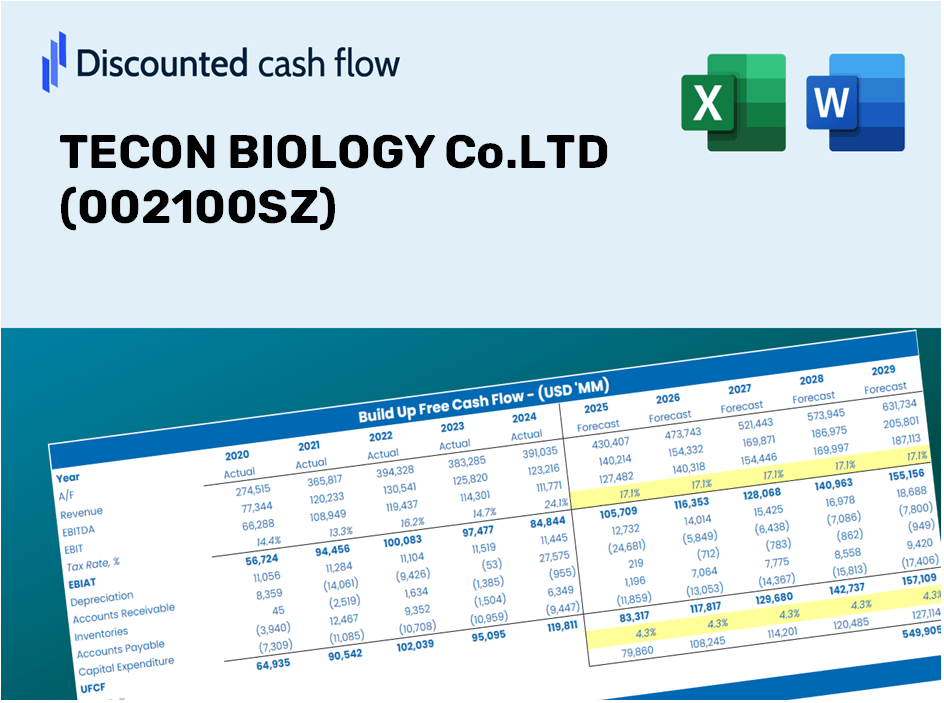
Discover the true potential of TECON BIOLOGY Co.LTD (002100SZ) with our advanced DCF Calculator! Adjust key assumptions, explore various scenarios, and evaluate how different changes affect the valuation of TECON BIOLOGY Co.LTD (002100SZ) – all within a single Excel template.
What You Will Receive
- Genuine TECON BIOLOGY Data: Comprehensive financials – from revenue to EBIT – based on authentic and projected metrics.
- Complete Customization: Modify all key parameters (yellow cells) such as WACC, growth %, and tax rates.
- Real-Time Valuation Adjustments: Automatic updates to assess the effects of changes on TECON BIOLOGY's fair value.
- Flexible Excel Template: Designed for easy modifications, scenario analysis, and in-depth forecasts.
- Efficient and Precise: Eliminate the need to build models from the ground up while ensuring accuracy and adaptability.
Key Features
- Comprehensive DCF Calculator: Features detailed unlevered and levered DCF valuation models tailored for TECON BIOLOGY Co.LTD (002100SZ).
- WACC Calculator: Includes a pre-designed Weighted Average Cost of Capital template with customizable parameters.
- Adjustable Forecast Assumptions: Easily modify growth rates, capital expenditures, and discount rates to suit your analysis.
- Integrated Financial Ratios: Evaluate profitability, leverage, and efficiency ratios specific to TECON BIOLOGY Co.LTD (002100SZ).
- Analytics Dashboard and Charts: Visual representations of key valuation metrics for streamlined analysis.
How It Works
- Step 1: Download the Excel file.
- Step 2: Examine the pre-populated financial data and forecasts for TECON BIOLOGY Co.LTD (002100SZ).
- Step 3: Adjust key inputs such as revenue growth, WACC, and tax rates (highlighted cells).
- Step 4: Observe the DCF model refresh immediately as you modify your assumptions.
- Step 5: Evaluate the results and utilize the findings for investment strategies.
Why Choose TECON BIOLOGY Co.LTD (002100SZ) Calculator?
- Save Time: Get started quickly with a pre-built DCF model – no setup required.
- Enhance Accuracy: Access dependable financial data and formulas to minimize valuation errors.
- Fully Customizable: Adjust the model to fit your specific assumptions and forecasts.
- Intuitive Design: User-friendly charts and outputs simplify result analysis.
- Endorsed by Professionals: Created for industry experts who prioritize accuracy and functionality.
Who Can Benefit from This Product?
- Professional Investors: Create comprehensive and trustworthy valuation models for assessing portfolios with TECON BIOLOGY (002100SZ).
- Corporate Finance Teams: Evaluate valuation scenarios to shape strategic decisions within the company.
- Consultants and Advisors: Deliver precise valuation insights for TECON BIOLOGY (002100SZ) to your clients.
- Students and Educators: Utilize real-world data for hands-on practice and teaching of financial modeling techniques.
- Biotechnology Enthusiasts: Gain insights into the valuation processes of biotech firms like TECON BIOLOGY (002100SZ).
Contents of the Template
- Pre-Filled DCF Model: TECON BIOLOGY's financial data preloaded for immediate analysis.
- WACC Calculator: Comprehensive calculations for the Weighted Average Cost of Capital.
- Financial Ratios: Assess TECON BIOLOGY's profitability, leverage, and operational efficiency.
- Editable Inputs: Modify assumptions like growth rates, profit margins, and capital expenditures to suit your analysis.
- Financial Statements: Access annual and quarterly reports for in-depth financial evaluation.
- Interactive Dashboard: Easily visualize essential valuation metrics and outcomes.
Disclaimer
All information, articles, and product details provided on this website are for general informational and educational purposes only. We do not claim any ownership over, nor do we intend to infringe upon, any trademarks, copyrights, logos, brand names, or other intellectual property mentioned or depicted on this site. Such intellectual property remains the property of its respective owners, and any references here are made solely for identification or informational purposes, without implying any affiliation, endorsement, or partnership.
We make no representations or warranties, express or implied, regarding the accuracy, completeness, or suitability of any content or products presented. Nothing on this website should be construed as legal, tax, investment, financial, medical, or other professional advice. In addition, no part of this site—including articles or product references—constitutes a solicitation, recommendation, endorsement, advertisement, or offer to buy or sell any securities, franchises, or other financial instruments, particularly in jurisdictions where such activity would be unlawful.
All content is of a general nature and may not address the specific circumstances of any individual or entity. It is not a substitute for professional advice or services. Any actions you take based on the information provided here are strictly at your own risk. You accept full responsibility for any decisions or outcomes arising from your use of this website and agree to release us from any liability in connection with your use of, or reliance upon, the content or products found herein.