
|
شركة Jiangxi Zhengbang Technology Co .Ltd. (002157.SZ) تقييم DCF |
Fully Editable: Tailor To Your Needs In Excel Or Sheets
Professional Design: Trusted, Industry-Standard Templates
Investor-Approved Valuation Models
MAC/PC Compatible, Fully Unlocked
No Expertise Is Needed; Easy To Follow
Jiangxi Zhengbang Technology Co.Ltd. (002157.SZ) Bundle
Enhance your investment choices with the (002157SZ) DCF Calculator! Dive into genuine Jiangxi Zhengbang Technology Co. Ltd. financials, adjust growth projections and expenses, and instantly observe how these changes affect the intrinsic value of (002157SZ).
Benefits You Will Receive
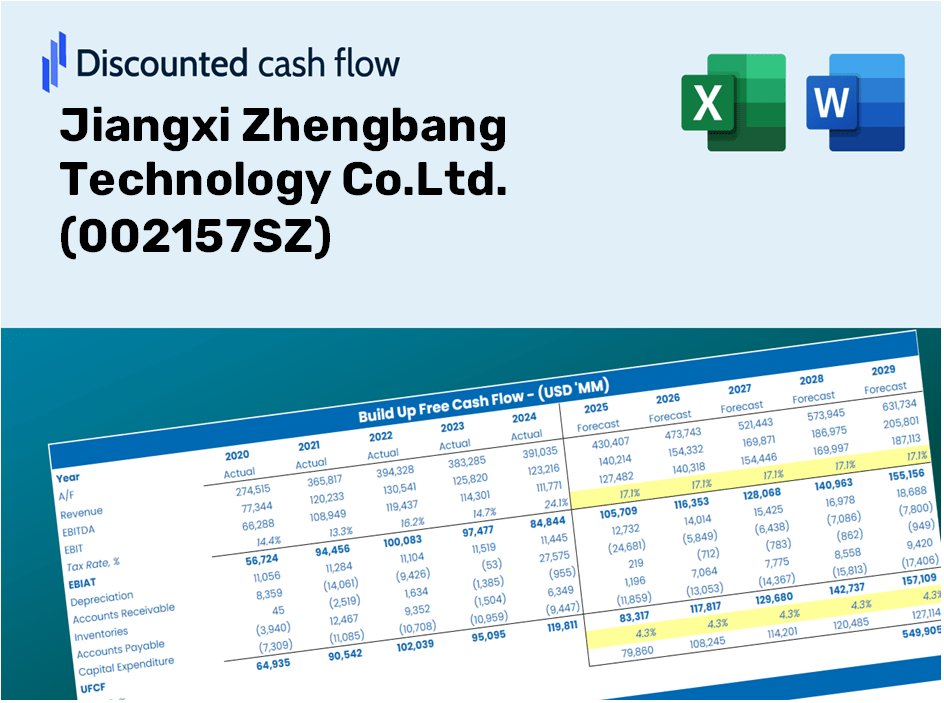
- Genuine Jiangxi Zhengbang Data: Preloaded financial information – from revenue to EBIT – based on both actual and forecasted figures.
- Comprehensive Customization: Modify all key parameters (yellow cells) such as WACC, growth percentage, and tax rates.
- Real-Time Valuation Adjustments: Automatic recalculations to evaluate the effects of changes on the fair value of Jiangxi Zhengbang Technology [002157SZ].
- Flexible Excel Template: Designed for easy modifications, scenario analysis, and in-depth projections.
- Efficient and Accurate: Avoid building models from the ground up while ensuring precision and adaptability.
Key Features
- Comprehensive Data: Historical financial statements and pre-populated forecasts for Jiangxi Zhengbang Technology Co., Ltd. (002157SZ).
- Customizable Inputs: Adjust WACC, tax rates, revenue growth, and EBITDA margins according to your analysis.
- Real-Time Calculations: Instantly view the intrinsic value of Jiangxi Zhengbang Technology Co., Ltd. (002157SZ) as it updates dynamically.
- Intuitive Visualizations: Dashboard charts showcase valuation results and essential metrics clearly.
- Designed for Precision: A professional-grade tool tailored for analysts, investors, and finance professionals.
How It Works
- Step 1: Download the Excel file for Jiangxi Zhengbang Technology Co. Ltd. (002157SZ).
- Step 2: Examine the pre-filled financial data and forecasts for Jiangxi Zhengbang Technology.
- Step 3: Adjust key inputs such as revenue growth, WACC, and tax rates (highlighted cells).
- Step 4: Observe the DCF model update in real-time as you modify your assumptions.
- Step 5: Review the outputs and leverage the findings for your investment strategies.
Why Opt for the Jiangxi Zhengbang Technology Calculator?
- Precision: Leveraging authentic Jiangxi Zhengbang financials for reliable data.
- Versatility: Crafted to allow users to effortlessly test and adjust inputs.
- Efficiency: Eliminate the need to create a DCF model from the ground up.
- Expert-Quality: Built with a focus on CFO-level accuracy and usability.
- Intuitive: Simple to navigate, even for those lacking advanced financial modeling skills.
Who Can Benefit from Jiangxi Zhengbang Technology Co., Ltd. (002157SZ)?
- Investors: Utilize an advanced valuation tool to make informed investment choices.
- Financial Analysts: Enhance efficiency with a customizable DCF model designed for your needs.
- Consultants: Easily modify the template for client-facing presentations and reports.
- Finance Enthusiasts: Expand your knowledge of valuation methods through practical examples.
- Educators and Students: Leverage this resource as a hands-on educational tool in finance courses.
Contents of the Template
- Preloaded 002157SZ Data: Historical and projected financial metrics, encompassing revenue, EBIT, and capital expenditures.
- DCF and WACC Models: Advanced spreadsheets for estimating intrinsic value and calculating the Weighted Average Cost of Capital.
- Editable Inputs: Yellow-highlighted fields for modifying revenue growth rates, tax percentages, and discount rates.
- Financial Statements: Detailed annual and quarterly financial reports for in-depth analysis.
- Key Ratios: Metrics on profitability, leverage, and efficiency for performance assessment.
- Dashboard and Charts: Visual overviews of valuation results and underlying assumptions.
Disclaimer
All information, articles, and product details provided on this website are for general informational and educational purposes only. We do not claim any ownership over, nor do we intend to infringe upon, any trademarks, copyrights, logos, brand names, or other intellectual property mentioned or depicted on this site. Such intellectual property remains the property of its respective owners, and any references here are made solely for identification or informational purposes, without implying any affiliation, endorsement, or partnership.
We make no representations or warranties, express or implied, regarding the accuracy, completeness, or suitability of any content or products presented. Nothing on this website should be construed as legal, tax, investment, financial, medical, or other professional advice. In addition, no part of this site—including articles or product references—constitutes a solicitation, recommendation, endorsement, advertisement, or offer to buy or sell any securities, franchises, or other financial instruments, particularly in jurisdictions where such activity would be unlawful.
All content is of a general nature and may not address the specific circumstances of any individual or entity. It is not a substitute for professional advice or services. Any actions you take based on the information provided here are strictly at your own risk. You accept full responsibility for any decisions or outcomes arising from your use of this website and agree to release us from any liability in connection with your use of, or reliance upon, the content or products found herein.