
|
Corp Corp. (002166.SZ) التقييم DCF (002166.SZ) DCF |
Fully Editable: Tailor To Your Needs In Excel Or Sheets
Professional Design: Trusted, Industry-Standard Templates
Investor-Approved Valuation Models
MAC/PC Compatible, Fully Unlocked
No Expertise Is Needed; Easy To Follow
Guilin Layn Natural Ingredients Corp. (002166.SZ) Bundle
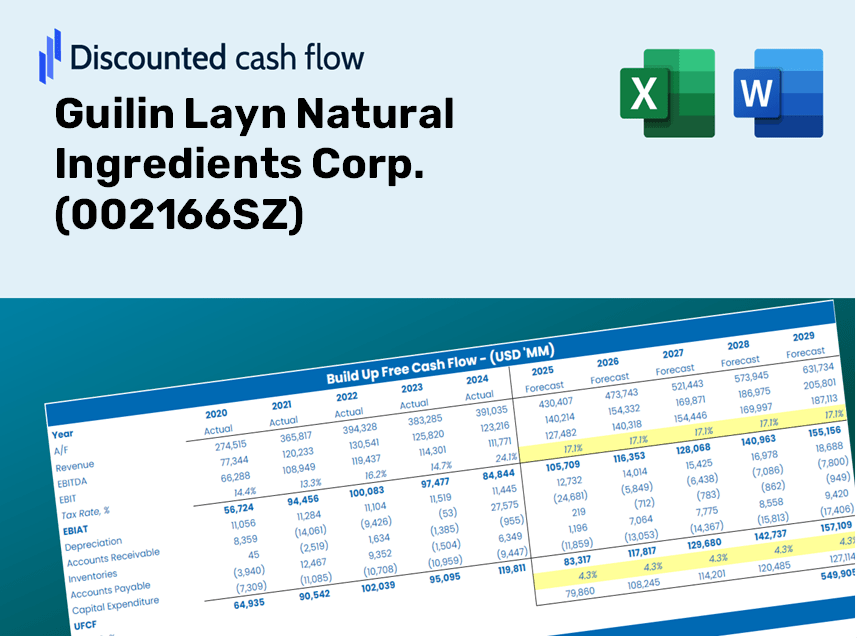
Designed for accuracy, our (002166SZ) DCF Calculator enables you to assess Guilin Layn Natural Ingredients Corp. valuation using up-to-date financial data, offering complete flexibility to modify all essential parameters for improved projections.
What You Will Receive
- Customizable Excel Template: A fully adjustable Excel-based DCF Calculator featuring pre-filled financial data for Guilin Layn Natural Ingredients Corp. (002166SZ).
- Authentic Data: Access to historical performance data along with forward-looking estimates (highlighted in the yellow cells).
- Adjustable Forecasts: Modify key assumptions such as revenue growth, EBITDA margins, and WACC.
- Real-Time Calculations: Immediately observe the effects of your inputs on Guilin Layn's valuation.
- Professional Resource: Designed for investors, CFOs, consultants, and financial analysts.
- Intuitive Design: Organized for straightforward navigation and usability, complete with step-by-step guidance.
Key Features
- Real-Time 002166SZ Data: Pre-loaded with Guilin Layn Natural Ingredients Corp.'s historical financials and future projections.
- Completely Customizable Inputs: Modify revenue growth rates, profit margins, WACC, tax rates, and capital expenditures as needed.
- Dynamic Valuation Model: Automatic recalculations of Net Present Value (NPV) and intrinsic value based on your tailored inputs.
- Scenario Analysis: Generate various forecast scenarios to assess different valuation possibilities.
- Intuitive User Interface: Clear, organized, and designed for both professionals and newcomers.
How It Functions
- Step 1: Download the ready-to-use Excel template featuring Guilin Layn Natural Ingredients Corp. (002166SZ) data.
- Step 2: Navigate through the pre-populated sheets to familiarize yourself with key performance indicators.
- Step 3: Modify the forecasts and assumptions in the editable yellow cells (WACC, growth, margins).
- Step 4: Instantly see the updated calculations, including the intrinsic value of Guilin Layn Natural Ingredients Corp. (002166SZ).
- Step 5: Make well-informed investment choices or create reports based on the results.
Why Choose This Calculator for Guilin Layn Natural Ingredients Corp. (002166SZ)?
- Designed for Experts: A sophisticated tool tailored for analysts, financial officers, and consultants.
- Comprehensive Data: Access to Guilin Layn’s historical and projected financials preloaded for precision.
- Dynamic Scenario Analysis: Effortlessly test various forecasts and assumptions.
- Intuitive Outputs: Automatically computes intrinsic value, NPV, and essential metrics.
- User-Friendly: Step-by-step guidance ensures a smooth navigation through the process.
Who Can Benefit from This Product?
- Individual Investors: Make well-informed choices regarding the purchase or sale of Guilin Layn Natural Ingredients Corp. (002166SZ) stock.
- Financial Analysts: Enhance your valuation processes with efficient, ready-to-use financial models.
- Consultants: Provide clients with accurate and timely valuation insights related to Guilin Layn Natural Ingredients Corp. (002166SZ).
- Business Owners: Gain insights into how major companies like Guilin Layn Natural Ingredients Corp. (002166SZ) are valued to inform your own strategic decisions.
- Finance Students: Master valuation techniques through practical, real-world data and scenarios involving Guilin Layn Natural Ingredients Corp. (002166SZ).
What the Template Contains
- Pre-Filled DCF Model: Guilin Layn Natural Ingredients Corp.’s (002166SZ) financial data preloaded for immediate use.
- WACC Calculator: Detailed calculations for Weighted Average Cost of Capital tailored to Guilin Layn Natural Ingredients Corp.
- Financial Ratios: Assess Guilin Layn’s profitability, leverage, and operational efficiency.
- Editable Inputs: Modify assumptions like growth, margins, and CAPEX to align with your specific scenarios.
- Financial Statements: Access annual and quarterly reports to facilitate comprehensive analysis.
- Interactive Dashboard: Effortlessly visualize key valuation metrics and outcomes.
Disclaimer
All information, articles, and product details provided on this website are for general informational and educational purposes only. We do not claim any ownership over, nor do we intend to infringe upon, any trademarks, copyrights, logos, brand names, or other intellectual property mentioned or depicted on this site. Such intellectual property remains the property of its respective owners, and any references here are made solely for identification or informational purposes, without implying any affiliation, endorsement, or partnership.
We make no representations or warranties, express or implied, regarding the accuracy, completeness, or suitability of any content or products presented. Nothing on this website should be construed as legal, tax, investment, financial, medical, or other professional advice. In addition, no part of this site—including articles or product references—constitutes a solicitation, recommendation, endorsement, advertisement, or offer to buy or sell any securities, franchises, or other financial instruments, particularly in jurisdictions where such activity would be unlawful.
All content is of a general nature and may not address the specific circumstances of any individual or entity. It is not a substitute for professional advice or services. Any actions you take based on the information provided here are strictly at your own risk. You accept full responsibility for any decisions or outcomes arising from your use of this website and agree to release us from any liability in connection with your use of, or reliance upon, the content or products found herein.