
|
شركة Tianshui Huatian Technology Co.، Ltd. (002185.SZ) تقييم DCF |
Fully Editable: Tailor To Your Needs In Excel Or Sheets
Professional Design: Trusted, Industry-Standard Templates
Investor-Approved Valuation Models
MAC/PC Compatible, Fully Unlocked
No Expertise Is Needed; Easy To Follow
Tianshui Huatian Technology Co., Ltd. (002185.SZ) Bundle
Discover the true value of Tianshui Huatian Technology Co., Ltd. (002185SZ) with our advanced DCF Calculator! Adjust key assumptions, explore various scenarios, and evaluate how changes affect the valuation of Tianshui Huatian Technology Co., Ltd. (002185SZ) – all within one convenient Excel template.
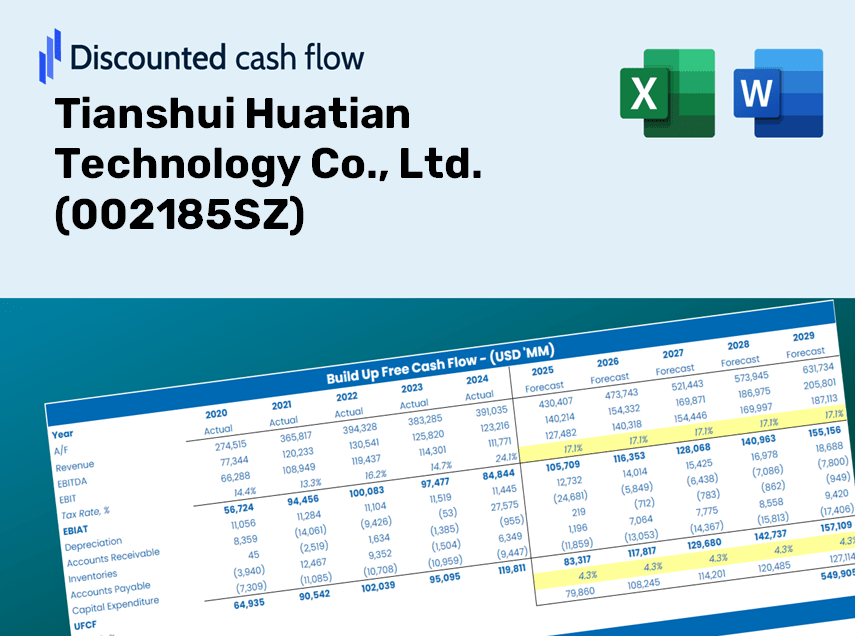
Discounted Cash Flow (DCF) - (USD MM)
| Year | AY1 2020 |
AY2 2021 |
AY3 2022 |
AY4 2023 |
AY5 2024 |
FY1 2025 |
FY2 2026 |
FY3 2027 |
FY4 2028 |
FY5 2029 |
|---|---|---|---|---|---|---|---|---|---|---|
| Revenue | 8,382.1 | 12,096.8 | 11,906.0 | 11,298.2 | 14,461.6 | 16,834.6 | 19,596.9 | 22,812.4 | 26,555.6 | 30,913.0 |
| Revenue Growth, % | 0 | 44.32 | -1.58 | -5.1 | 28 | 16.41 | 16.41 | 16.41 | 16.41 | 16.41 |
| EBITDA | 2,469.3 | 3,911.0 | 3,581.9 | 2,943.1 | 3,595.7 | 4,807.5 | 5,596.4 | 6,514.7 | 7,583.6 | 8,828.0 |
| EBITDA, % | 29.46 | 32.33 | 30.08 | 26.05 | 24.86 | 28.56 | 28.56 | 28.56 | 28.56 | 28.56 |
| Depreciation | 1,441.9 | 1,846.8 | 2,319.1 | 2,453.1 | 2,603.0 | 3,086.1 | 3,592.5 | 4,182.0 | 4,868.2 | 5,667.0 |
| Depreciation, % | 17.2 | 15.27 | 19.48 | 21.71 | 18 | 18.33 | 18.33 | 18.33 | 18.33 | 18.33 |
| EBIT | 1,027.4 | 2,064.2 | 1,262.7 | 490.0 | 992.7 | 1,721.4 | 2,003.9 | 2,332.7 | 2,715.5 | 3,161.0 |
| EBIT, % | 12.26 | 17.06 | 10.61 | 4.34 | 6.86 | 10.23 | 10.23 | 10.23 | 10.23 | 10.23 |
| Total Cash | 2,907.0 | 7,133.0 | 5,547.8 | 6,345.5 | 6,495.1 | 8,125.0 | 9,458.2 | 11,010.2 | 12,816.8 | 14,919.8 |
| Total Cash, percent | .0 | .0 | .0 | .0 | .0 | .0 | .0 | .0 | .0 | .0 |
| Account Receivables | 1,649.9 | 1,941.5 | 1,960.5 | 35.9 | 2,681.8 | 2,392.6 | 2,785.2 | 3,242.2 | 3,774.2 | 4,393.5 |
| Account Receivables, % | 19.68 | 16.05 | 16.47 | 0.31791 | 18.54 | 14.21 | 14.21 | 14.21 | 14.21 | 14.21 |
| Inventories | 1,367.2 | 2,174.0 | 2,253.8 | 2,126.5 | 2,152.8 | 2,926.5 | 3,406.7 | 3,965.7 | 4,616.4 | 5,373.9 |
| Inventories, % | 16.31 | 17.97 | 18.93 | 18.82 | 14.89 | 17.38 | 17.38 | 17.38 | 17.38 | 17.38 |
| Accounts Payable | 2,148.8 | 2,918.1 | 2,769.6 | 2,813.9 | 3,860.5 | 4,195.9 | 4,884.3 | 5,685.8 | 6,618.7 | 7,704.8 |
| Accounts Payable, % | 25.64 | 24.12 | 23.26 | 24.91 | 26.69 | 24.92 | 24.92 | 24.92 | 24.92 | 24.92 |
| Capital Expenditure | -3,044.7 | -5,535.0 | -5,378.4 | -3,714.0 | -5,001.3 | -6,555.7 | -7,631.4 | -8,883.6 | -10,341.3 | -12,038.1 |
| Capital Expenditure, % | -36.32 | -45.76 | -45.17 | -32.87 | -34.58 | -38.94 | -38.94 | -38.94 | -38.94 | -38.94 |
| Tax Rate, % | 10.95 | 10.95 | 10.95 | 10.95 | 10.95 | 10.95 | 10.95 | 10.95 | 10.95 | 10.95 |
| EBITAT | 794.2 | 1,543.1 | 1,207.4 | 480.8 | 883.9 | 1,497.1 | 1,742.8 | 2,028.7 | 2,361.6 | 2,749.1 |
| Depreciation | ||||||||||
| Changes in Account Receivables | ||||||||||
| Changes in Inventories | ||||||||||
| Changes in Accounts Payable | ||||||||||
| Capital Expenditure | ||||||||||
| UFCF | -1,677.0 | -2,474.2 | -2,099.1 | 1,316.0 | -3,139.9 | -2,121.6 | -2,480.4 | -2,887.4 | -3,361.2 | -3,912.7 |
| WACC, % | 5.34 | 5.32 | 5.47 | 5.49 | 5.42 | 5.41 | 5.41 | 5.41 | 5.41 | 5.41 |
| PV UFCF | ||||||||||
| SUM PV UFCF | -12,440.0 | |||||||||
| Long Term Growth Rate, % | 3.00 | |||||||||
| Free cash flow (T + 1) | -4,030 | |||||||||
| Terminal Value | -167,316 | |||||||||
| Present Terminal Value | -128,575 | |||||||||
| Enterprise Value | -141,015 | |||||||||
| Net Debt | 3,966 | |||||||||
| Equity Value | -144,981 | |||||||||
| Diluted Shares Outstanding, MM | 3,205 | |||||||||
| Equity Value Per Share | -45.24 |
What You Will Receive
- Authentic Tianshui Huatian Financials: Access to both historical and projected data for precise valuation.
- Customizable Inputs: Adjust WACC, tax rates, revenue growth, and capital expenditures as needed.
- Automated Calculations: Dynamic calculations for intrinsic value and NPV.
- Scenario Analysis: Evaluate Tianshui Huatian's future performance through various scenarios.
- User-Friendly Design: Designed for industry professionals while remaining easy to use for newcomers.
Key Features
- Real-Time Tianshui Huatian Data: Pre-loaded with Tianshui Huatian Technology's historical performance and future projections.
- Customizable Input Options: Tailor revenue growth, profit margins, WACC, tax rates, and capital expenditures to fit your analysis.
- Interactive Valuation Model: Automatically refreshes Net Present Value (NPV) and intrinsic value based on your entered data.
- Scenario Analysis: Develop various forecast scenarios to explore alternative valuation results.
- Intuitive User Interface: Designed for ease of use, catering to both experienced analysts and newcomers.
How It Operates
- Download: Obtain the pre-formulated Excel file containing financial data for Tianshui Huatian Technology Co., Ltd. (002185SZ).
- Customize: Modify projections such as revenue growth, EBITDA %, and WACC to fit your analysis.
- Real-Time Updates: The intrinsic value and NPV calculations refresh automatically as you make changes.
- Scenario Testing: Develop various forecasts and instantly evaluate different results.
- Informed Decisions: Leverage the valuation findings to shape your investment strategy.
Why Opt for Tianshui Huatian Technology Co., Ltd. (002185SZ)?
- Time Efficiency: Skip the hassle of building a model from scratch – our tools are ready to go.
- Enhanced Precision: Dependable financial insights and calculations minimize valuation errors.
- Completely Customizable: Adjust the model to match your specific assumptions and projections.
- User-Friendly: Intuitive charts and outputs simplify the analysis of results.
- Endorsed by Professionals: Developed for experts who prioritize accuracy and functionality.
Who Should Utilize This Product?
- Professional Investors: Develop comprehensive and trustworthy valuation models for analyzing portfolios centered around Tianshui Huatian Technology Co., Ltd. (002185SZ).
- Corporate Finance Teams: Evaluate valuation scenarios to inform strategic decision-making within the company.
- Consultants and Advisors: Equip clients with precise valuation insights regarding Tianshui Huatian Technology Co., Ltd. (002185SZ).
- Students and Educators: Leverage real-world data to enhance learning and practice in financial modeling.
- Tech Enthusiasts: Gain insights into the market valuation of technology companies such as Tianshui Huatian Technology Co., Ltd. (002185SZ).
Contents of the Template
- Pre-Filled Data: Contains Tianshui Huatian Technology Co., Ltd.'s historical financials and projections.
- Discounted Cash Flow Model: An editable DCF valuation model with automated calculations.
- Weighted Average Cost of Capital (WACC): A dedicated worksheet for computing WACC using custom inputs.
- Key Financial Ratios: Assess Tianshui Huatian's profitability, efficiency, and leverage.
- Customizable Inputs: Easily adjust revenue growth, margins, and tax rates.
- Clear Dashboard: Visualizations and tables that summarize vital valuation outcomes.
Disclaimer
All information, articles, and product details provided on this website are for general informational and educational purposes only. We do not claim any ownership over, nor do we intend to infringe upon, any trademarks, copyrights, logos, brand names, or other intellectual property mentioned or depicted on this site. Such intellectual property remains the property of its respective owners, and any references here are made solely for identification or informational purposes, without implying any affiliation, endorsement, or partnership.
We make no representations or warranties, express or implied, regarding the accuracy, completeness, or suitability of any content or products presented. Nothing on this website should be construed as legal, tax, investment, financial, medical, or other professional advice. In addition, no part of this site—including articles or product references—constitutes a solicitation, recommendation, endorsement, advertisement, or offer to buy or sell any securities, franchises, or other financial instruments, particularly in jurisdictions where such activity would be unlawful.
All content is of a general nature and may not address the specific circumstances of any individual or entity. It is not a substitute for professional advice or services. Any actions you take based on the information provided here are strictly at your own risk. You accept full responsibility for any decisions or outcomes arising from your use of this website and agree to release us from any liability in connection with your use of, or reliance upon, the content or products found herein.