
|
شركة Shenzhen Jinjia Group Co.، Ltd. (002191.SZ) تقييم DCF |
Fully Editable: Tailor To Your Needs In Excel Or Sheets
Professional Design: Trusted, Industry-Standard Templates
Investor-Approved Valuation Models
MAC/PC Compatible, Fully Unlocked
No Expertise Is Needed; Easy To Follow
Shenzhen Jinjia Group Co.,Ltd. (002191.SZ) Bundle
Designed for accuracy, our (002191SZ) DCF Calculator allows you to evaluate Shenzhen Jinjia Group Co., Ltd. valuation using real-world financial data and provides complete flexibility to modify all key parameters for enhanced projections.
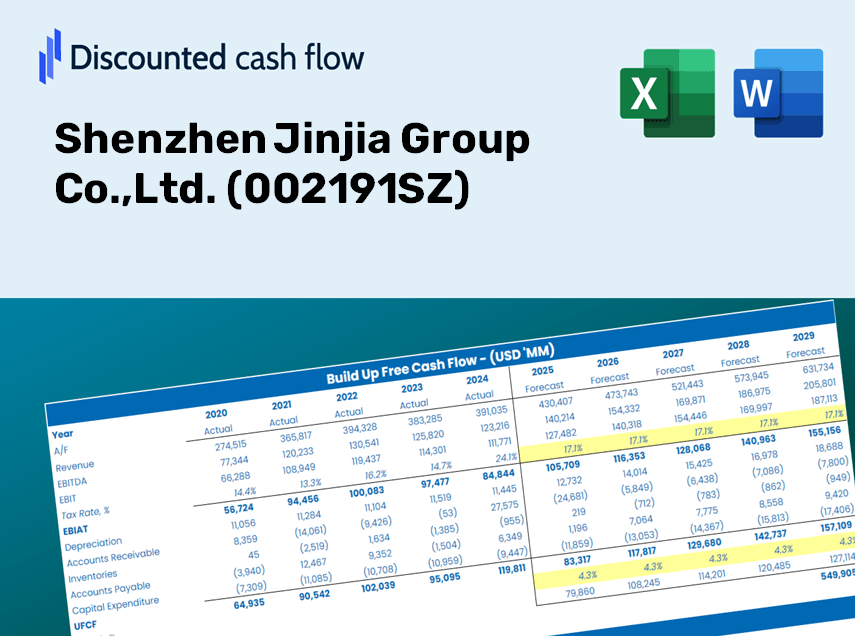
Discounted Cash Flow (DCF) - (USD MM)
| Year | AY1 2020 |
AY2 2021 |
AY3 2022 |
AY4 2023 |
AY5 2024 |
FY1 2025 |
FY2 2026 |
FY3 2027 |
FY4 2028 |
FY5 2029 |
|---|---|---|---|---|---|---|---|---|---|---|
| Revenue | 4,191.4 | 5,067.1 | 5,188.6 | 3,945.5 | 2,857.2 | 3,018.5 | 3,189.0 | 3,369.2 | 3,559.5 | 3,760.5 |
| Revenue Growth, % | 0 | 20.89 | 2.4 | -23.96 | -27.58 | 5.65 | 5.65 | 5.65 | 5.65 | 5.65 |
| EBITDA | 1,111.7 | 1,393.7 | 518.4 | 401.4 | 308.7 | 513.1 | 542.1 | 572.8 | 605.1 | 639.3 |
| EBITDA, % | 26.52 | 27.51 | 9.99 | 10.17 | 10.81 | 17 | 17 | 17 | 17 | 17 |
| Depreciation | 192.1 | 187.4 | 230.3 | 207.8 | 175.7 | 145.7 | 153.9 | 162.6 | 171.8 | 181.5 |
| Depreciation, % | 4.58 | 3.7 | 4.44 | 5.27 | 6.15 | 4.83 | 4.83 | 4.83 | 4.83 | 4.83 |
| EBIT | 919.6 | 1,206.3 | 288.1 | 193.5 | 133.0 | 367.4 | 388.2 | 410.1 | 433.3 | 457.7 |
| EBIT, % | 21.94 | 23.81 | 5.55 | 4.91 | 4.66 | 12.17 | 12.17 | 12.17 | 12.17 | 12.17 |
| Total Cash | 2,225.6 | 2,094.3 | 1,534.3 | 1,416.8 | 1,148.0 | 1,208.0 | 1,276.2 | 1,348.3 | 1,424.4 | 1,504.9 |
| Total Cash, percent | .0 | .0 | .0 | .0 | .0 | .0 | .0 | .0 | .0 | .0 |
| Account Receivables | 746.6 | 1,204.1 | 1,414.0 | 1,151.3 | 2,027.1 | 1,020.0 | 1,077.6 | 1,138.5 | 1,202.8 | 1,270.7 |
| Account Receivables, % | 17.81 | 23.76 | 27.25 | 29.18 | 70.95 | 33.79 | 33.79 | 33.79 | 33.79 | 33.79 |
| Inventories | 639.2 | 1,057.9 | 981.8 | 771.2 | 560.9 | 568.9 | 601.0 | 635.0 | 670.8 | 708.7 |
| Inventories, % | 15.25 | 20.88 | 18.92 | 19.55 | 19.63 | 18.85 | 18.85 | 18.85 | 18.85 | 18.85 |
| Accounts Payable | 892.2 | 1,449.8 | 607.4 | 1,239.8 | 886.1 | 748.9 | 791.2 | 835.8 | 883.1 | 932.9 |
| Accounts Payable, % | 21.29 | 28.61 | 11.71 | 31.42 | 31.01 | 24.81 | 24.81 | 24.81 | 24.81 | 24.81 |
| Capital Expenditure | -173.7 | -381.8 | -260.9 | -118.2 | -73.4 | -134.5 | -142.1 | -150.1 | -158.6 | -167.5 |
| Capital Expenditure, % | -4.14 | -7.53 | -5.03 | -3 | -2.57 | -4.45 | -4.45 | -4.45 | -4.45 | -4.45 |
| Tax Rate, % | 43.37 | 43.37 | 43.37 | 43.37 | 43.37 | 43.37 | 43.37 | 43.37 | 43.37 | 43.37 |
| EBITAT | 762.6 | 1,028.6 | 171.2 | 123.2 | 75.3 | 255.7 | 270.1 | 285.4 | 301.5 | 318.5 |
| Depreciation | ||||||||||
| Changes in Account Receivables | ||||||||||
| Changes in Inventories | ||||||||||
| Changes in Accounts Payable | ||||||||||
| Capital Expenditure | ||||||||||
| UFCF | 287.4 | 515.7 | -835.6 | 1,318.5 | -841.6 | 1,128.9 | 234.6 | 247.8 | 261.8 | 276.6 |
| WACC, % | 6.65 | 6.65 | 6.61 | 6.62 | 6.61 | 6.63 | 6.63 | 6.63 | 6.63 | 6.63 |
| PV UFCF | ||||||||||
| SUM PV UFCF | 1,872.6 | |||||||||
| Long Term Growth Rate, % | 3.00 | |||||||||
| Free cash flow (T + 1) | 285 | |||||||||
| Terminal Value | 7,850 | |||||||||
| Present Terminal Value | 5,695 | |||||||||
| Enterprise Value | 7,568 | |||||||||
| Net Debt | -888 | |||||||||
| Equity Value | 8,456 | |||||||||
| Diluted Shares Outstanding, MM | 1,440 | |||||||||
| Equity Value Per Share | 5.87 |
What You Will Receive
- Authentic 002191SZ Financial Data: Pre-loaded with Shenzhen Jinjia Group’s historical and forecasted data for accurate analysis.
- Completely Customizable Template: Easily adjust key inputs such as revenue growth, WACC, and EBITDA percentages.
- Instant Calculations: Watch the intrinsic value of Shenzhen Jinjia Group update immediately based on your modifications.
- Professional Valuation Tool: Tailored for investors, analysts, and consultants aiming for precise DCF results.
- User-Friendly Interface: Intuitive layout and clear instructions suitable for users of all skill levels.
Key Features
- Comprehensive DCF Calculator: Offers detailed unlevered and levered DCF valuation models tailored for Shenzhen Jinjia Group Co., Ltd. (002191SZ).
- WACC Calculator: Comes with a pre-configured Weighted Average Cost of Capital sheet featuring customizable inputs specific to the company.
- Customizable Forecast Assumptions: Adjust growth rates, capital expenditures, and discount rates to reflect your business outlook.
- Integrated Financial Ratios: Evaluate profitability, leverage, and efficiency ratios relevant to Shenzhen Jinjia Group Co., Ltd. (002191SZ).
- Interactive Dashboard and Charts: Visual representations of key valuation metrics for simplified analysis.
How It Functions
- Download: Obtain the pre-configured Excel spreadsheet containing Shenzhen Jinjia Group Co., Ltd.'s financial data.
- Customize: Modify projections, such as revenue growth, EBITDA%, and WACC to fit your analysis.
- Auto-Update: The intrinsic value and NPV calculations refresh in real-time as you make changes.
- Explore Scenarios: Develop various forecasts and instantly evaluate different outcomes.
- Make Informed Decisions: Leverage the valuation insights to shape your investment strategy.
Why Opt for This Calculator?
- Reliable Data: Actual financial figures from Shenzhen Jinjia Group Co., Ltd. ensure trustworthy valuation outcomes.
- Adaptable: Tailor essential metrics such as growth rates, WACC, and tax rates to fit your forecasts.
- Efficient: Built-in calculations save you the hassle of starting from square one.
- Professional-Quality Tool: Crafted for investors, analysts, and consultants alike.
- Easy to Use: A straightforward interface and clear instructions make it accessible for everyone.
Who Can Benefit from This Product?
- Finance Students: Master valuation techniques and apply them using real-world data related to Shenzhen Jinjia Group Co., Ltd. (002191SZ).
- Academics: Integrate industry-standard models into your curriculum or research focused on Shenzhen Jinjia Group Co., Ltd. (002191SZ).
- Investors: Validate your hypotheses and evaluate valuation results for Shenzhen Jinjia Group Co., Ltd. (002191SZ).
- Analysts: Enhance your efficiency with a customizable DCF model specifically designed for Shenzhen Jinjia Group Co., Ltd. (002191SZ).
- Small Business Owners: Understand the analytical methods applied to large public enterprises like Shenzhen Jinjia Group Co., Ltd. (002191SZ).
Contents of the Template
- Operating and Balance Sheet Data: Pre-filled historical data and forecasts for Shenzhen Jinjia Group Co., Ltd. (002191SZ), including revenue, EBITDA, EBIT, and capital expenditures.
- WACC Calculation: A dedicated sheet for calculating the Weighted Average Cost of Capital (WACC), featuring parameters such as Beta, risk-free rate, and share price.
- DCF Valuation (Unlevered and Levered): Customizable Discounted Cash Flow models displaying intrinsic value with comprehensive calculations.
- Financial Statements: Pre-loaded financial statements (both annual and quarterly) to facilitate thorough analysis.
- Key Ratios: Provides crucial profitability, leverage, and efficiency ratios for Shenzhen Jinjia Group Co., Ltd. (002191SZ).
- Dashboard and Charts: Visual summary of valuation outputs and assumptions for easy result analysis.
Disclaimer
All information, articles, and product details provided on this website are for general informational and educational purposes only. We do not claim any ownership over, nor do we intend to infringe upon, any trademarks, copyrights, logos, brand names, or other intellectual property mentioned or depicted on this site. Such intellectual property remains the property of its respective owners, and any references here are made solely for identification or informational purposes, without implying any affiliation, endorsement, or partnership.
We make no representations or warranties, express or implied, regarding the accuracy, completeness, or suitability of any content or products presented. Nothing on this website should be construed as legal, tax, investment, financial, medical, or other professional advice. In addition, no part of this site—including articles or product references—constitutes a solicitation, recommendation, endorsement, advertisement, or offer to buy or sell any securities, franchises, or other financial instruments, particularly in jurisdictions where such activity would be unlawful.
All content is of a general nature and may not address the specific circumstances of any individual or entity. It is not a substitute for professional advice or services. Any actions you take based on the information provided here are strictly at your own risk. You accept full responsibility for any decisions or outcomes arising from your use of this website and agree to release us from any liability in connection with your use of, or reliance upon, the content or products found herein.