
|
شركة YOUNGY المحدودة (002192.SZ) تقييم DCF |
Fully Editable: Tailor To Your Needs In Excel Or Sheets
Professional Design: Trusted, Industry-Standard Templates
Investor-Approved Valuation Models
MAC/PC Compatible, Fully Unlocked
No Expertise Is Needed; Easy To Follow
YOUNGY Co.,Ltd. (002192.SZ) Bundle
Optimize your time and improve precision with our (002192SZ) DCF Calculator! Utilizing real data from YOUNGY Co., Ltd. and customizable assumptions, this tool empowers you to forecast, analyze, and value YOUNGY Co., Ltd. like an expert investor.
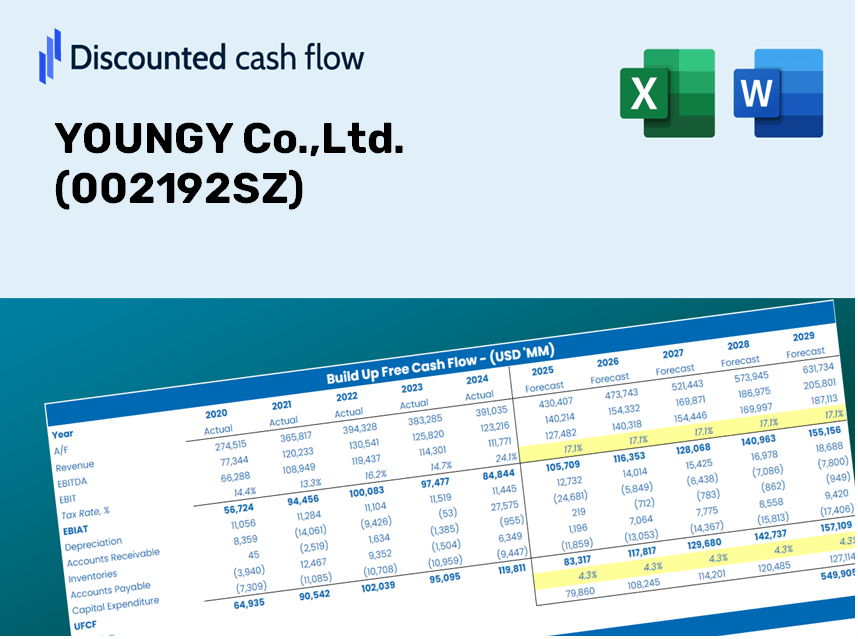
Discounted Cash Flow (DCF) - (USD MM)
| Year | AY1 2020 |
AY2 2021 |
AY3 2022 |
AY4 2023 |
AY5 2024 |
FY1 2025 |
FY2 2026 |
FY3 2027 |
FY4 2028 |
FY5 2029 |
|---|---|---|---|---|---|---|---|---|---|---|
| Revenue | 389.9 | 920.6 | 2,992.4 | 1,210.9 | 561.4 | 683.3 | 831.6 | 1,012.1 | 1,231.8 | 1,499.2 |
| Revenue Growth, % | 0 | 136.09 | 225.05 | -59.53 | -53.64 | 21.71 | 21.71 | 21.71 | 21.71 | 21.71 |
| EBITDA | 44.3 | 139.7 | 1,315.9 | 329.1 | 153.7 | 170.9 | 208.0 | 253.1 | 308.1 | 374.9 |
| EBITDA, % | 11.36 | 15.18 | 43.97 | 27.18 | 27.37 | 25.01 | 25.01 | 25.01 | 25.01 | 25.01 |
| Depreciation | 24.4 | 25.2 | 27.9 | 36.4 | 40.7 | 27.6 | 33.6 | 40.9 | 49.8 | 60.6 |
| Depreciation, % | 6.26 | 2.73 | 0.93395 | 3.01 | 7.26 | 4.04 | 4.04 | 4.04 | 4.04 | 4.04 |
| EBIT | 19.8 | 114.5 | 1,287.9 | 292.7 | 112.9 | 143.3 | 174.4 | 212.2 | 258.3 | 314.4 |
| EBIT, % | 5.09 | 12.44 | 43.04 | 24.17 | 20.11 | 20.97 | 20.97 | 20.97 | 20.97 | 20.97 |
| Total Cash | 33.6 | 107.3 | 1,748.5 | 1,524.1 | 1,658.5 | 380.9 | 463.5 | 564.2 | 686.6 | 835.7 |
| Total Cash, percent | .0 | .0 | .0 | .0 | .0 | .0 | .0 | .0 | .0 | .0 |
| Account Receivables | 237.2 | 358.7 | 439.4 | 416.5 | 170.1 | 244.8 | 298.0 | 362.7 | 441.4 | 537.2 |
| Account Receivables, % | 60.83 | 38.96 | 14.68 | 34.39 | 30.3 | 35.83 | 35.83 | 35.83 | 35.83 | 35.83 |
| Inventories | 64.5 | 148.1 | 141.7 | 113.4 | 70.7 | 81.1 | 98.7 | 120.1 | 146.2 | 177.9 |
| Inventories, % | 16.55 | 16.08 | 4.74 | 9.36 | 12.6 | 11.87 | 11.87 | 11.87 | 11.87 | 11.87 |
| Accounts Payable | 78.3 | 93.7 | 110.3 | 54.2 | 44.6 | 63.3 | 77.1 | 93.8 | 114.2 | 138.9 |
| Accounts Payable, % | 20.07 | 10.17 | 3.69 | 4.47 | 7.94 | 9.27 | 9.27 | 9.27 | 9.27 | 9.27 |
| Capital Expenditure | -88.5 | -90.7 | -135.7 | -297.1 | -297.7 | -156.7 | -190.7 | -232.0 | -282.4 | -343.7 |
| Capital Expenditure, % | -22.69 | -9.85 | -4.54 | -24.54 | -53.02 | -22.93 | -22.93 | -22.93 | -22.93 | -22.93 |
| Tax Rate, % | 6.3 | 6.3 | 6.3 | 6.3 | 6.3 | 6.3 | 6.3 | 6.3 | 6.3 | 6.3 |
| EBITAT | 17.9 | 72.4 | 1,169.5 | 280.3 | 105.8 | 124.3 | 151.3 | 184.2 | 224.2 | 272.8 |
| Depreciation | ||||||||||
| Changes in Account Receivables | ||||||||||
| Changes in Inventories | ||||||||||
| Changes in Accounts Payable | ||||||||||
| Capital Expenditure | ||||||||||
| UFCF | -269.6 | -182.7 | 1,004.0 | 14.8 | 128.3 | -71.0 | -62.7 | -76.4 | -92.9 | -113.1 |
| WACC, % | 5.57 | 5.55 | 5.57 | 5.57 | 5.57 | 5.57 | 5.57 | 5.57 | 5.57 | 5.57 |
| PV UFCF | ||||||||||
| SUM PV UFCF | -349.5 | |||||||||
| Long Term Growth Rate, % | 3.00 | |||||||||
| Free cash flow (T + 1) | -116 | |||||||||
| Terminal Value | -4,539 | |||||||||
| Present Terminal Value | -3,462 | |||||||||
| Enterprise Value | -3,812 | |||||||||
| Net Debt | -1,174 | |||||||||
| Equity Value | -2,637 | |||||||||
| Diluted Shares Outstanding, MM | 260 | |||||||||
| Equity Value Per Share | -10.16 |
What You Will Receive
- Authentic YOUNGY Financial Data: Pre-loaded with historical and projected data for accurate analysis.
- Completely Customizable Template: Easily adjust key inputs such as revenue growth, WACC, and EBITDA %.
- Instant Calculations: Watch the intrinsic value of YOUNGY update in real-time as you make adjustments.
- Professional Valuation Tool: Tailored for investors, analysts, and consultants aiming for precise DCF outcomes.
- User-Friendly Interface: Intuitive layout and straightforward instructions suitable for all skill levels.
Highlighted Features
- Genuine YOUNGY Financial Data: Gain access to reliable, pre-loaded historical figures and future forecasts.
- Adjustable Forecast Parameters: Modify the yellow-highlighted fields such as WACC, growth rates, and profit margins.
- Real-Time Calculations: Enjoy instantaneous updates for DCF, Net Present Value (NPV), and cash flow assessments.
- Interactive Visual Dashboard: Utilize user-friendly charts and summaries for clear insight into your valuation findings.
- Designed for All Users: A straightforward, intuitive framework crafted for investors, CFOs, and consultants alike.
How It Works
- Step 1: Download the Excel file.
- Step 2: Examine YOUNGY Co., Ltd.'s pre-filled financial data and forecasts.
- Step 3: Adjust key inputs such as revenue growth, WACC, and tax rates (highlighted cells).
- Step 4: Observe the DCF model update in real-time as you modify assumptions.
- Step 5: Evaluate the outputs and leverage the results for your investment decisions.
Why Choose the YOUNGY Co., Ltd. Calculator?
- Designed for Experts: A sophisticated tool favored by analysts, CFOs, and consultants.
- Comprehensive Data: YOUNGY Co., Ltd.'s historical and projected financials are preloaded for enhanced accuracy.
- Scenario Analysis: Effortlessly simulate various forecasts and assumptions.
- Intuitive Outputs: Automatically calculates intrinsic value, NPV, and essential metrics.
- User-Friendly: Step-by-step guidance ensures a smooth experience.
Who Can Benefit from YOUNGY Co., Ltd. (002192SZ)?
- Finance Students: Master valuation methodologies and apply them with real market data.
- Academics: Integrate professional valuation models into your studies or research projects.
- Investors: Validate your assumptions and explore valuation insights for YOUNGY Co., Ltd. (002192SZ).
- Analysts: Enhance your efficiency with a customizable, ready-to-use DCF model.
- Small Business Owners: Discover how major public corporations like YOUNGY Co., Ltd. (002192SZ) are valued and analyzed.
Contents of the Template
- Historical Data: Contains YOUNGY Co.,Ltd.'s past financial records and baseline projections.
- DCF and Levered DCF Models: Comprehensive templates for assessing the intrinsic value of YOUNGY Co.,Ltd. (002192SZ).
- WACC Sheet: Ready-to-use calculations for the Weighted Average Cost of Capital.
- Editable Inputs: Adjust critical drivers such as growth rates, EBITDA percentages, and CAPEX assumptions.
- Quarterly and Annual Statements: A thorough breakdown of YOUNGY Co.,Ltd.'s financial information.
- Interactive Dashboard: Dynamically visualize valuation outcomes and forecasts.
Disclaimer
All information, articles, and product details provided on this website are for general informational and educational purposes only. We do not claim any ownership over, nor do we intend to infringe upon, any trademarks, copyrights, logos, brand names, or other intellectual property mentioned or depicted on this site. Such intellectual property remains the property of its respective owners, and any references here are made solely for identification or informational purposes, without implying any affiliation, endorsement, or partnership.
We make no representations or warranties, express or implied, regarding the accuracy, completeness, or suitability of any content or products presented. Nothing on this website should be construed as legal, tax, investment, financial, medical, or other professional advice. In addition, no part of this site—including articles or product references—constitutes a solicitation, recommendation, endorsement, advertisement, or offer to buy or sell any securities, franchises, or other financial instruments, particularly in jurisdictions where such activity would be unlawful.
All content is of a general nature and may not address the specific circumstances of any individual or entity. It is not a substitute for professional advice or services. Any actions you take based on the information provided here are strictly at your own risk. You accept full responsibility for any decisions or outcomes arising from your use of this website and agree to release us from any liability in connection with your use of, or reliance upon, the content or products found herein.