
|
شركة Sanquan Food Co. ، Ltd. (002216.SZ) تقييم DCF |
Fully Editable: Tailor To Your Needs In Excel Or Sheets
Professional Design: Trusted, Industry-Standard Templates
Investor-Approved Valuation Models
MAC/PC Compatible, Fully Unlocked
No Expertise Is Needed; Easy To Follow
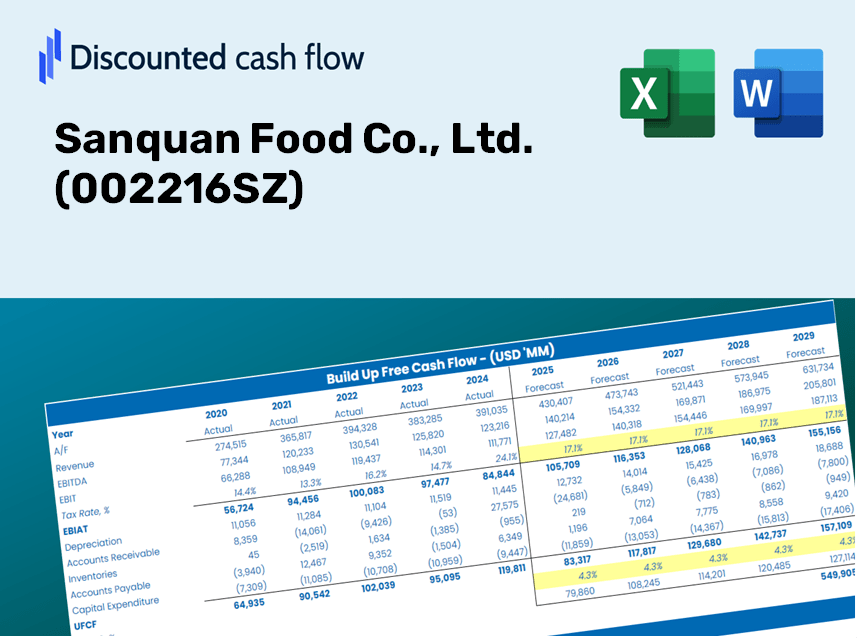
Sanquan Food Co., Ltd. (002216.SZ) Bundle
Simplify Sanquan Food Co., Ltd. valuation with this customizable DCF Calculator! Featuring real Sanquan Food Co., Ltd. financials and adjustable forecast inputs, you can test scenarios and uncover Sanquan Food Co., Ltd. fair value in minutes.
What You Will Receive
- Authentic 002216 Financial Data: Pre-loaded with Sanquan Food's historical and forecasted figures for accurate analysis.
- Completely Customizable Template: Easily adjust essential inputs such as revenue growth, WACC, and EBITDA percentage.
- Instant Calculations: Watch Sanquan Food’s intrinsic value refresh automatically as you make changes.
- Expert Valuation Tool: Tailored for investors, analysts, and consultants aiming for precise DCF outcomes.
- Intuitive Layout: Streamlined design and straightforward instructions suitable for all skill levels.
Key Features
- Pre-Loaded Data: Sanquan Food Co., Ltd.'s historical financial statements and pre-filled forecasts.
- Fully Adjustable Inputs: Customize WACC, tax rates, revenue growth, and EBITDA margins as needed.
- Instant Results: View the intrinsic value of Sanquan Food Co., Ltd. refresh in real time.
- Clear Visual Outputs: Dashboard charts illustrate valuation results and essential metrics.
- Built for Accuracy: A professional tool designed for analysts, investors, and finance professionals.
How It Works
- Step 1: Download the Excel file.
- Step 2: Review the pre-filled Sanquan Food data (historical and projected).
- Step 3: Modify key assumptions (yellow cells) according to your analysis.
- Step 4: Observe automatic recalculations for Sanquan Food's intrinsic value.
- Step 5: Utilize the results for investment decisions or reporting purposes.
Why Opt for Sanquan Food Co., Ltd. Calculator?
- Efficient: Eliminate the hassle of starting a DCF model from the ground up – it's ready for immediate use.
- Enhanced Precision: Dependable financial data and formulas minimize valuation errors.
- Completely Customizable: Adjust the model to align with your specific assumptions and forecasts.
- User-Friendly: Intuitive charts and outputs simplify data interpretation.
- Preferred by Professionals: Crafted for industry experts who prioritize accuracy and ease of use.
Who Can Benefit from Sanquan Food Co., Ltd. (002216SZ) Products?
- Investors: Gain insight into your investment choices with our expert-level valuation tools.
- Financial Analysts: Streamline your workflow with our customizable, pre-designed DCF models.
- Consultants: Effortlessly modify our templates for impactful client presentations or analytical reports.
- Finance Enthusiasts: Enhance your knowledge of valuation strategies through practical, real-world examples.
- Educators and Students: Leverage our resources as a hands-on learning aid for finance courses.
Contents of the Template
- Pre-Filled DCF Model: Sanquan Food Co., Ltd. (002216SZ) financial data preloaded for immediate application.
- WACC Calculator: Comprehensive calculations for Weighted Average Cost of Capital.
- Financial Ratios: Analyze Sanquan's profitability, leverage, and operational efficiency.
- Editable Inputs: Adjust assumptions such as growth rates, margins, and CAPEX to align with your projections.
- Financial Statements: Annual and quarterly reports to facilitate in-depth analysis.
- Interactive Dashboard: Effortlessly visualize essential valuation metrics and outcomes.
Disclaimer
All information, articles, and product details provided on this website are for general informational and educational purposes only. We do not claim any ownership over, nor do we intend to infringe upon, any trademarks, copyrights, logos, brand names, or other intellectual property mentioned or depicted on this site. Such intellectual property remains the property of its respective owners, and any references here are made solely for identification or informational purposes, without implying any affiliation, endorsement, or partnership.
We make no representations or warranties, express or implied, regarding the accuracy, completeness, or suitability of any content or products presented. Nothing on this website should be construed as legal, tax, investment, financial, medical, or other professional advice. In addition, no part of this site—including articles or product references—constitutes a solicitation, recommendation, endorsement, advertisement, or offer to buy or sell any securities, franchises, or other financial instruments, particularly in jurisdictions where such activity would be unlawful.
All content is of a general nature and may not address the specific circumstances of any individual or entity. It is not a substitute for professional advice or services. Any actions you take based on the information provided here are strictly at your own risk. You accept full responsibility for any decisions or outcomes arising from your use of this website and agree to release us from any liability in connection with your use of, or reliance upon, the content or products found herein.