
|
Hongbo Co. ، Ltd. (002229.SZ) تقييم DCF |
Fully Editable: Tailor To Your Needs In Excel Or Sheets
Professional Design: Trusted, Industry-Standard Templates
Investor-Approved Valuation Models
MAC/PC Compatible, Fully Unlocked
No Expertise Is Needed; Easy To Follow
Hongbo Co., Ltd. (002229.SZ) Bundle
Explore the financial potential of Hongbo Co., Ltd. (002229SZ) with our user-friendly DCF Calculator! Enter your projections for growth, profit margins, and expenses to calculate the intrinsic value of Hongbo Co., Ltd. (002229SZ) and enhance your investment strategy.
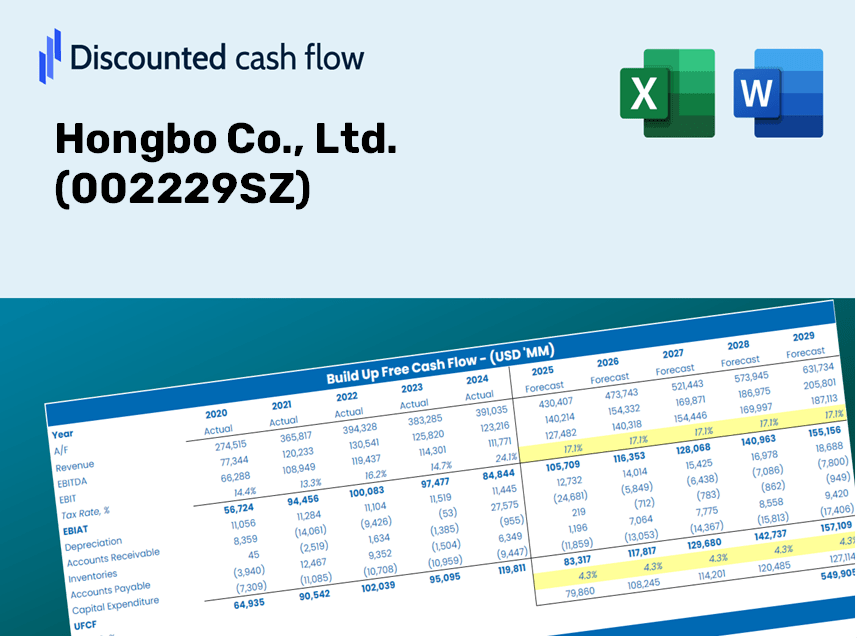
Discounted Cash Flow (DCF) - (USD MM)
| Year | AY1 2020 |
AY2 2021 |
AY3 2022 |
AY4 2023 |
AY5 2024 |
FY1 2025 |
FY2 2026 |
FY3 2027 |
FY4 2028 |
FY5 2029 |
|---|---|---|---|---|---|---|---|---|---|---|
| Revenue | 473.8 | 574.4 | 545.6 | 619.8 | 510.1 | 525.6 | 541.5 | 557.9 | 574.8 | 592.2 |
| Revenue Growth, % | 0 | 21.23 | -5.01 | 13.58 | -17.69 | 3.03 | 3.03 | 3.03 | 3.03 | 3.03 |
| EBITDA | 29.7 | 52.4 | -1.2 | 26.3 | -65.3 | 7.0 | 7.2 | 7.4 | 7.6 | 7.8 |
| EBITDA, % | 6.28 | 9.12 | -0.21562 | 4.24 | -12.8 | 1.32 | 1.32 | 1.32 | 1.32 | 1.32 |
| Depreciation | 51.2 | 44.3 | 42.1 | 49.9 | 72.1 | 50.9 | 52.5 | 54.0 | 55.7 | 57.4 |
| Depreciation, % | 10.81 | 7.72 | 7.72 | 8.05 | 14.14 | 9.69 | 9.69 | 9.69 | 9.69 | 9.69 |
| EBIT | -21.5 | 8.0 | -43.3 | -23.6 | -137.4 | -44.0 | -45.3 | -46.7 | -48.1 | -49.5 |
| EBIT, % | -4.53 | 1.4 | -7.94 | -3.8 | -26.94 | -8.36 | -8.36 | -8.36 | -8.36 | -8.36 |
| Total Cash | 926.8 | 1,091.0 | 1,096.8 | 832.9 | 653.7 | 525.6 | 541.5 | 557.9 | 574.8 | 592.2 |
| Total Cash, percent | .0 | .0 | .0 | .0 | .0 | .0 | .0 | .0 | .0 | .0 |
| Account Receivables | 91.5 | 188.9 | 199.3 | 255.7 | 208.7 | 179.6 | 185.1 | 190.7 | 196.5 | 202.4 |
| Account Receivables, % | 19.3 | 32.88 | 36.53 | 41.25 | 40.92 | 34.18 | 34.18 | 34.18 | 34.18 | 34.18 |
| Inventories | 109.1 | 77.8 | 86.5 | 243.6 | 800.2 | 201.5 | 207.6 | 213.9 | 220.4 | 227.1 |
| Inventories, % | 23.02 | 13.55 | 15.85 | 39.31 | 156.86 | 38.35 | 38.35 | 38.35 | 38.35 | 38.35 |
| Accounts Payable | 81.4 | 101.7 | 94.2 | 119.4 | 205.8 | 117.5 | 121.0 | 124.7 | 128.5 | 132.4 |
| Accounts Payable, % | 17.17 | 17.71 | 17.26 | 19.27 | 40.35 | 22.35 | 22.35 | 22.35 | 22.35 | 22.35 |
| Capital Expenditure | -7.4 | -8.0 | -51.9 | -244.6 | -9.2 | -56.5 | -58.2 | -59.9 | -61.8 | -63.6 |
| Capital Expenditure, % | -1.56 | -1.39 | -9.51 | -39.47 | -1.8 | -10.74 | -10.74 | -10.74 | -10.74 | -10.74 |
| Tax Rate, % | -2.74 | -2.74 | -2.74 | -2.74 | -2.74 | -2.74 | -2.74 | -2.74 | -2.74 | -2.74 |
| EBITAT | -10.8 | 3.3 | -71.9 | -46.9 | -141.2 | -34.3 | -35.4 | -36.5 | -37.6 | -38.7 |
| Depreciation | ||||||||||
| Changes in Account Receivables | ||||||||||
| Changes in Inventories | ||||||||||
| Changes in Accounts Payable | ||||||||||
| Capital Expenditure | ||||||||||
| UFCF | -86.1 | -6.2 | -108.3 | -429.8 | -501.4 | 499.5 | -49.1 | -50.6 | -52.1 | -53.7 |
| WACC, % | 4.53 | 4.49 | 4.73 | 4.73 | 4.73 | 4.64 | 4.64 | 4.64 | 4.64 | 4.64 |
| PV UFCF | ||||||||||
| SUM PV UFCF | 302.1 | |||||||||
| Long Term Growth Rate, % | 4.00 | |||||||||
| Free cash flow (T + 1) | -56 | |||||||||
| Terminal Value | -8,738 | |||||||||
| Present Terminal Value | -6,966 | |||||||||
| Enterprise Value | -6,663 | |||||||||
| Net Debt | -258 | |||||||||
| Equity Value | -6,406 | |||||||||
| Diluted Shares Outstanding, MM | 493 | |||||||||
| Equity Value Per Share | -12.99 |
What You Will Receive
- Customizable Excel Template: A fully adaptable Excel-based DCF Calculator featuring pre-filled real Hongbo Co., Ltd. financial data.
- Accurate Data: Historical figures and forward-looking estimates (highlighted in the yellow cells).
- Assumption Adjustability: Easily modify forecast parameters such as revenue growth, EBITDA %, and WACC.
- Instant Calculations: Quickly view how your inputs affect the valuation of Hongbo Co., Ltd. (002229SZ).
- Professional Resource: Designed for investors, CFOs, consultants, and financial analysts.
- Intuitive Layout: Organized for clarity and usability, complete with step-by-step guidance.
Key Features
- 🔍 Real-Life Hongbo Co., Ltd. (002229SZ) Financials: Access pre-filled historical and projected data for Hongbo Co., Ltd.
- ✏️ Fully Customizable Inputs: Tailor all essential parameters (yellow cells) such as WACC, growth percentage, and tax rates.
- 📊 Professional DCF Valuation: Integrated formulas assess Hongbo’s intrinsic value using the Discounted Cash Flow (DCF) method.
- ⚡ Instant Results: Visualize Hongbo’s valuation immediately after making any adjustments.
- Scenario Analysis: Evaluate and compare different outcomes based on various financial assumptions side-by-side.
How It Functions
- 1. Access the Template: Download and launch the Excel file featuring Hongbo Co., Ltd. (002229SZ) preloaded data.
- 2. Adjust Key Inputs: Modify essential variables such as growth rates, WACC, and capital expenditures.
- 3. Analyze Results Instantly: The DCF model automatically computes the intrinsic value and NPV.
- 4. Explore Scenarios: Compare various forecasts to evaluate different valuation results.
- 5. Utilize with Assurance: Present expert valuation insights to reinforce your decision-making process.
Why Opt for Hongbo Co., Ltd. Calculator?
- Reliable Data: Authentic Hongbo Co., Ltd. financials provide trustworthy valuation outcomes.
- Tailorable: Modify essential parameters such as growth rates, WACC, and tax rates to align with your forecasts.
- Efficiency: Built-in calculations save you from starting from the ground up.
- Professional Quality: Crafted for investors, analysts, and consultants dedicated to Hongbo Co., Ltd. (002229SZ).
- Easy to Navigate: User-friendly design and clear step-by-step guidance cater to all skill levels.
Who Can Benefit from This Product?
- Investors: Make informed investment choices by accurately assessing the fair value of Hongbo Co., Ltd. (002229SZ).
- CFOs: Utilize a professional-grade DCF model for comprehensive financial reporting and analysis.
- Consultants: Seamlessly customize the template for valuation reports tailored to client needs.
- Entrepreneurs: Discover valuable insights into the financial modeling techniques of leading companies.
- Educators: Employ this resource as a teaching aid to illustrate various valuation methodologies.
Contents of the Template
- Pre-Filled Data: Incorporates Hongbo Co., Ltd.'s historical financial performance and forecasts.
- Discounted Cash Flow Model: An editable DCF valuation model equipped with automatic calculations.
- Weighted Average Cost of Capital (WACC): A dedicated worksheet for WACC calculation based on customized inputs.
- Key Financial Ratios: Assess Hongbo Co., Ltd.'s profitability, efficiency, and leverage.
- Customizable Inputs: Easily modify revenue growth, profit margins, and tax rates.
- Clear Dashboard: Visual representations, including charts and tables, summarizing essential valuation results.
Disclaimer
All information, articles, and product details provided on this website are for general informational and educational purposes only. We do not claim any ownership over, nor do we intend to infringe upon, any trademarks, copyrights, logos, brand names, or other intellectual property mentioned or depicted on this site. Such intellectual property remains the property of its respective owners, and any references here are made solely for identification or informational purposes, without implying any affiliation, endorsement, or partnership.
We make no representations or warranties, express or implied, regarding the accuracy, completeness, or suitability of any content or products presented. Nothing on this website should be construed as legal, tax, investment, financial, medical, or other professional advice. In addition, no part of this site—including articles or product references—constitutes a solicitation, recommendation, endorsement, advertisement, or offer to buy or sell any securities, franchises, or other financial instruments, particularly in jurisdictions where such activity would be unlawful.
All content is of a general nature and may not address the specific circumstances of any individual or entity. It is not a substitute for professional advice or services. Any actions you take based on the information provided here are strictly at your own risk. You accept full responsibility for any decisions or outcomes arising from your use of this website and agree to release us from any liability in connection with your use of, or reliance upon, the content or products found herein.