
|
شركة Zhejiang Dahua Technology Co. ، Ltd. (002236.SZ) تقييم DCF |
Fully Editable: Tailor To Your Needs In Excel Or Sheets
Professional Design: Trusted, Industry-Standard Templates
Investor-Approved Valuation Models
MAC/PC Compatible, Fully Unlocked
No Expertise Is Needed; Easy To Follow
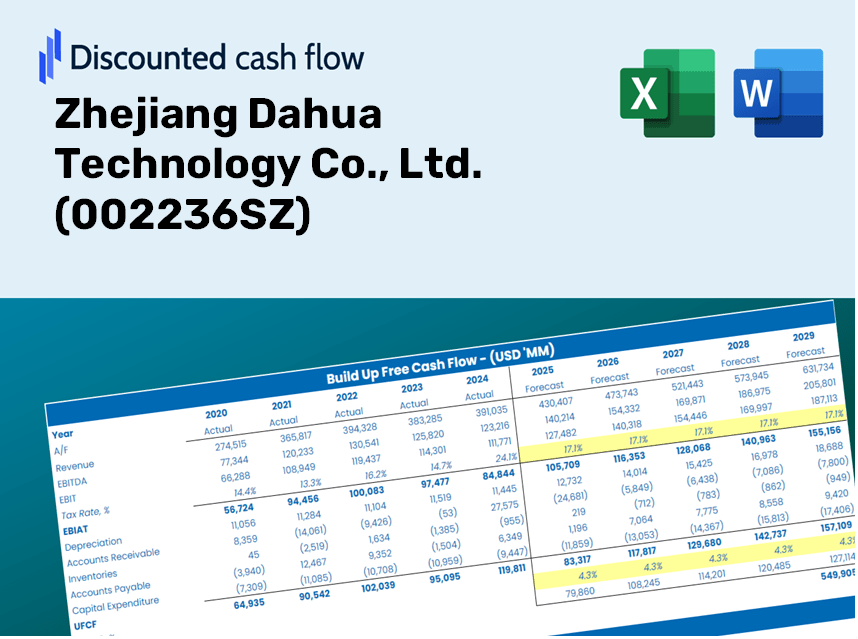
Zhejiang Dahua Technology Co., Ltd. (002236.SZ) Bundle
Whether you’re an investor or analyst, this [Symbol] DCF Calculator is your go-to resource for accurate valuation. Preloaded with data from Zhejiang Dahua Technology Co., Ltd., you can adjust forecasts and observe the effects in real-time.
Discounted Cash Flow (DCF) - (USD MM)
| Year | AY1 2020 |
AY2 2021 |
AY3 2022 |
AY4 2023 |
AY5 2024 |
FY1 2025 |
FY2 2026 |
FY3 2027 |
FY4 2028 |
FY5 2029 |
|---|---|---|---|---|---|---|---|---|---|---|
| Revenue | 26,466.0 | 32,835.5 | 30,565.4 | 32,218.3 | 32,180.9 | 33,986.7 | 35,893.8 | 37,907.9 | 40,035.0 | 42,281.5 |
| Revenue Growth, % | 0 | 24.07 | -6.91 | 5.41 | -0.11604 | 5.61 | 5.61 | 5.61 | 5.61 | 5.61 |
| EBITDA | 3,560.1 | 3,930.2 | 1,816.9 | 3,500.2 | 2,562.4 | 3,411.7 | 3,603.2 | 3,805.3 | 4,018.9 | 4,244.4 |
| EBITDA, % | 13.45 | 11.97 | 5.94 | 10.86 | 7.96 | 10.04 | 10.04 | 10.04 | 10.04 | 10.04 |
| Depreciation | 309.0 | 364.4 | 550.2 | 609.6 | 630.0 | 538.8 | 569.1 | 601.0 | 634.7 | 670.4 |
| Depreciation, % | 1.17 | 1.11 | 1.8 | 1.89 | 1.96 | 1.59 | 1.59 | 1.59 | 1.59 | 1.59 |
| EBIT | 3,251.1 | 3,565.8 | 1,266.7 | 2,890.5 | 1,932.4 | 2,872.9 | 3,034.1 | 3,204.3 | 3,384.1 | 3,574.0 |
| EBIT, % | 12.28 | 10.86 | 4.14 | 8.97 | 6 | 8.45 | 8.45 | 8.45 | 8.45 | 8.45 |
| Total Cash | 7,474.1 | 7,733.6 | 8,031.3 | 15,972.5 | 11,411.7 | 11,086.9 | 11,709.0 | 12,366.0 | 13,059.9 | 13,792.7 |
| Total Cash, percent | .0 | .0 | .0 | .0 | .0 | .0 | .0 | .0 | .0 | .0 |
| Account Receivables | 16,454.7 | 17,053.1 | 18,747.7 | 18,290.7 | 19,046.8 | 19,807.6 | 20,919.0 | 22,092.9 | 23,332.5 | 24,641.8 |
| Account Receivables, % | 62.17 | 51.93 | 61.34 | 56.77 | 59.19 | 58.28 | 58.28 | 58.28 | 58.28 | 58.28 |
| Inventories | 4,928.0 | 6,810.0 | 7,315.4 | 5,332.6 | 5,203.6 | 6,526.5 | 6,892.7 | 7,279.4 | 7,687.9 | 8,119.3 |
| Inventories, % | 18.62 | 20.74 | 23.93 | 16.55 | 16.17 | 19.2 | 19.2 | 19.2 | 19.2 | 19.2 |
| Accounts Payable | 9,703.3 | 11,802.7 | 11,704.4 | 9,111.4 | 9,478.0 | 11,462.6 | 12,105.8 | 12,785.1 | 13,502.5 | 14,260.2 |
| Accounts Payable, % | 36.66 | 35.95 | 38.29 | 28.28 | 29.45 | 33.73 | 33.73 | 33.73 | 33.73 | 33.73 |
| Capital Expenditure | -641.7 | -1,227.4 | -1,295.4 | -1,445.9 | -907.5 | -1,203.7 | -1,271.3 | -1,342.6 | -1,418.0 | -1,497.5 |
| Capital Expenditure, % | -2.42 | -3.74 | -4.24 | -4.49 | -2.82 | -3.54 | -3.54 | -3.54 | -3.54 | -3.54 |
| Tax Rate, % | 2.8 | 2.8 | 2.8 | 2.8 | 2.8 | 2.8 | 2.8 | 2.8 | 2.8 | 2.8 |
| EBITAT | 2,986.4 | 3,472.1 | 1,287.3 | 2,620.1 | 1,878.3 | 2,741.1 | 2,894.9 | 3,057.4 | 3,228.9 | 3,410.1 |
| Depreciation | ||||||||||
| Changes in Account Receivables | ||||||||||
| Changes in Inventories | ||||||||||
| Changes in Accounts Payable | ||||||||||
| Capital Expenditure | ||||||||||
| UFCF | -9,025.7 | 2,228.0 | -1,756.2 | 1,630.6 | 1,340.3 | 1,977.2 | 1,358.2 | 1,434.5 | 1,515.0 | 1,600.0 |
| WACC, % | 6.3 | 6.31 | 6.31 | 6.3 | 6.31 | 6.31 | 6.31 | 6.31 | 6.31 | 6.31 |
| PV UFCF | ||||||||||
| SUM PV UFCF | 6,620.1 | |||||||||
| Long Term Growth Rate, % | 3.50 | |||||||||
| Free cash flow (T + 1) | 1,656 | |||||||||
| Terminal Value | 58,959 | |||||||||
| Present Terminal Value | 43,422 | |||||||||
| Enterprise Value | 50,042 | |||||||||
| Net Debt | -10,072 | |||||||||
| Equity Value | 60,114 | |||||||||
| Diluted Shares Outstanding, MM | 3,229 | |||||||||
| Equity Value Per Share | 18.62 |
What You Will Receive
- Adjustable Forecast Parameters: Effortlessly modify key assumptions (growth %, margins, WACC) to generate various scenarios.
- Accurate Market Data: Zhejiang Dahua Technology Co., Ltd.’s financial information pre-loaded to kickstart your evaluation.
- Automatic DCF Calculations: The template computes Net Present Value (NPV) and intrinsic value for you.
- Customizable and Professional Design: A sleek Excel model that tailors to your valuation requirements.
- Designed for Analysts and Investors: Perfect for evaluating projections, confirming strategies, and enhancing efficiency.
Key Features
- Pre-Loaded Data: Historical financial statements and pre-filled forecasts for Zhejiang Dahua Technology Co., Ltd. (002236SZ).
- Fully Adjustable Inputs: Customize WACC, tax rates, revenue growth, and EBITDA margins as needed.
- Instant Results: View the intrinsic value of Zhejiang Dahua Technology Co., Ltd. (002236SZ) recalculated in real time.
- Clear Visual Outputs: Dashboard charts showcase valuation results and essential metrics.
- Built for Accuracy: A reliable tool designed for analysts, investors, and finance professionals.
How It Works
- Step 1: Download the Excel spreadsheet.
- Step 2: Examine Dahua Technology’s pre-populated financial information and projections.
- Step 3: Adjust key variables such as revenue growth, WACC, and tax rates (highlighted cells).
- Step 4: Observe the DCF model refresh in real-time as you modify your assumptions.
- Step 5: Evaluate the results and leverage the findings for investment choices.
Why Choose This Calculator for Zhejiang Dahua Technology Co., Ltd. (002236SZ)?
- Designed for Industry Experts: A sophisticated tool tailored for analysts, financial officers, and consultants.
- Comprehensive Data: Historical and projected financial information for Zhejiang Dahua Technology preloaded for enhanced precision.
- Flexible Scenario Analysis: Easily test various forecasts and assumptions to explore potential outcomes.
- Insightful Results: Automatically computes intrinsic value, NPV, and essential financial metrics.
- User-Friendly Interface: Step-by-step guidance ensures a smooth navigation through the process.
Who Can Benefit from This Product?
- Investors: Effectively assess the fair market value of Zhejiang Dahua Technology Co., Ltd. (002236SZ) prior to making investment choices.
- CFOs: Utilize a high-quality DCF model for comprehensive financial reporting and analysis.
- Consultants: Easily customize the template for valuation reports tailored to client needs.
- Entrepreneurs: Discover valuable insights into financial modeling techniques employed by leading companies.
- Educators: Employ this as a resource for teaching valuation methods in an academic setting.
What the Template Includes
- Historical Data: Features Zhejiang Dahua Technology Co., Ltd.'s past financials and baseline forecasts.
- DCF and Levered DCF Models: Comprehensive templates for determining the intrinsic value of Zhejiang Dahua Technology Co., Ltd. (002236SZ).
- WACC Sheet: Pre-configured calculations for the Weighted Average Cost of Capital.
- Editable Inputs: Customize key drivers such as growth rates, EBITDA %, and CAPEX assumptions.
- Quarterly and Annual Statements: A thorough overview of Zhejiang Dahua Technology Co., Ltd.'s financials.
- Interactive Dashboard: Dynamically visualize valuation outcomes and projections.
Disclaimer
All information, articles, and product details provided on this website are for general informational and educational purposes only. We do not claim any ownership over, nor do we intend to infringe upon, any trademarks, copyrights, logos, brand names, or other intellectual property mentioned or depicted on this site. Such intellectual property remains the property of its respective owners, and any references here are made solely for identification or informational purposes, without implying any affiliation, endorsement, or partnership.
We make no representations or warranties, express or implied, regarding the accuracy, completeness, or suitability of any content or products presented. Nothing on this website should be construed as legal, tax, investment, financial, medical, or other professional advice. In addition, no part of this site—including articles or product references—constitutes a solicitation, recommendation, endorsement, advertisement, or offer to buy or sell any securities, franchises, or other financial instruments, particularly in jurisdictions where such activity would be unlawful.
All content is of a general nature and may not address the specific circumstances of any individual or entity. It is not a substitute for professional advice or services. Any actions you take based on the information provided here are strictly at your own risk. You accept full responsibility for any decisions or outcomes arising from your use of this website and agree to release us from any liability in connection with your use of, or reliance upon, the content or products found herein.