
|
Goertek Inc. (002241.SZ) تقييم DCF |
Fully Editable: Tailor To Your Needs In Excel Or Sheets
Professional Design: Trusted, Industry-Standard Templates
Investor-Approved Valuation Models
MAC/PC Compatible, Fully Unlocked
No Expertise Is Needed; Easy To Follow
Goertek Inc. (002241.SZ) Bundle
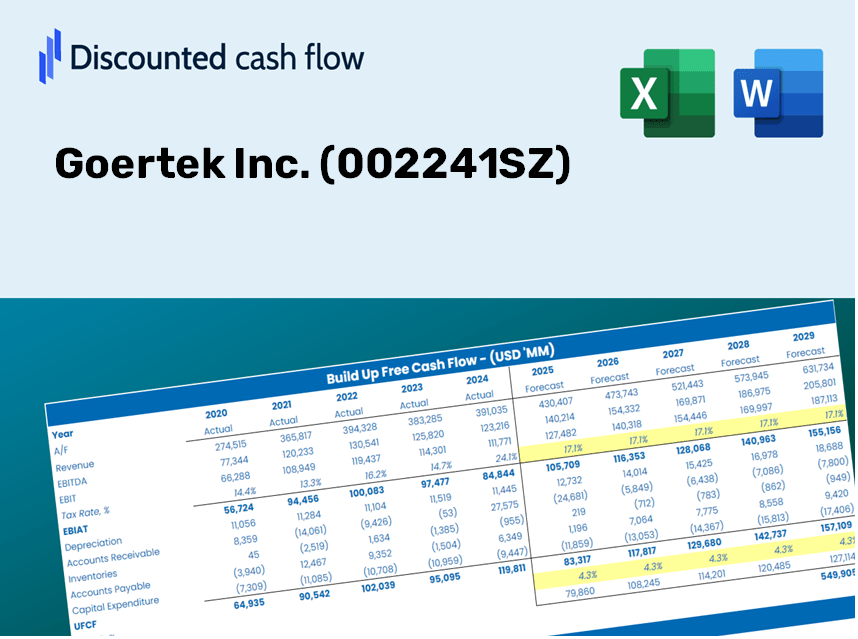
Discover the true value of Goertek Inc. (002241SZ) with our advanced DCF Calculator! Adjust essential assumptions, explore various scenarios, and evaluate how changes affect Goertek Inc. (002241SZ) valuation – all within one convenient Excel template.
Discounted Cash Flow (DCF) - (USD MM)
| Year | AY1 2020 |
AY2 2021 |
AY3 2022 |
AY4 2023 |
AY5 2024 |
FY1 2025 |
FY2 2026 |
FY3 2027 |
FY4 2028 |
FY5 2029 |
|---|---|---|---|---|---|---|---|---|---|---|
| Revenue | 57,742.7 | 78,221.4 | 104,894.3 | 98,573.9 | 100,953.8 | 117,599.5 | 136,989.7 | 159,577.1 | 185,888.7 | 216,538.8 |
| Revenue Growth, % | 0 | 35.47 | 34.1 | -6.03 | 2.41 | 16.49 | 16.49 | 16.49 | 16.49 | 16.49 |
| EBITDA | 5,510.4 | 6,711.3 | 5,551.8 | 4,605.1 | 6,538.0 | 8,129.3 | 9,469.7 | 11,031.1 | 12,849.9 | 14,968.7 |
| EBITDA, % | 9.54 | 8.58 | 5.29 | 4.67 | 6.48 | 6.91 | 6.91 | 6.91 | 6.91 | 6.91 |
| Depreciation | 2,136.9 | 2,706.3 | 3,425.5 | 3,714.1 | 3,723.9 | 4,206.0 | 4,899.5 | 5,707.4 | 6,648.5 | 7,744.7 |
| Depreciation, % | 3.7 | 3.46 | 3.27 | 3.77 | 3.69 | 3.58 | 3.58 | 3.58 | 3.58 | 3.58 |
| EBIT | 3,373.5 | 4,005.0 | 2,126.3 | 891.0 | 2,814.0 | 3,923.3 | 4,570.2 | 5,323.7 | 6,201.5 | 7,224.0 |
| EBIT, % | 5.84 | 5.12 | 2.03 | 0.90386 | 2.79 | 3.34 | 3.34 | 3.34 | 3.34 | 3.34 |
| Total Cash | 8,038.9 | 10,167.8 | 13,021.5 | 15,324.8 | 18,567.5 | 17,233.8 | 20,075.3 | 23,385.4 | 27,241.3 | 31,733.0 |
| Total Cash, percent | .0 | .0 | .0 | .0 | .0 | .0 | .0 | .0 | .0 | .0 |
| Account Receivables | 10,044.7 | 11,963.9 | 14,444.4 | 12,573.1 | 18,140.0 | 18,153.7 | 21,147.0 | 24,633.8 | 28,695.5 | 33,426.9 |
| Account Receivables, % | 17.4 | 15.29 | 13.77 | 12.76 | 17.97 | 15.44 | 15.44 | 15.44 | 15.44 | 15.44 |
| Inventories | 9,170.7 | 12,082.3 | 17,348.7 | 10,794.9 | 10,478.9 | 16,275.4 | 18,959.0 | 22,085.0 | 25,726.4 | 29,968.3 |
| Inventories, % | 15.88 | 15.45 | 16.54 | 10.95 | 10.38 | 13.84 | 13.84 | 13.84 | 13.84 | 13.84 |
| Accounts Payable | 17,324.2 | 21,272.5 | 30,599.3 | 17,582.3 | 20,437.3 | 29,270.5 | 34,096.7 | 39,718.7 | 46,267.7 | 53,896.4 |
| Accounts Payable, % | 30 | 27.2 | 29.17 | 17.84 | 20.24 | 24.89 | 24.89 | 24.89 | 24.89 | 24.89 |
| Capital Expenditure | -5,599.3 | -6,961.6 | -8,090.1 | -6,949.8 | -3,634.4 | -8,692.9 | -10,126.2 | -11,795.9 | -13,740.8 | -16,006.5 |
| Capital Expenditure, % | -9.7 | -8.9 | -7.71 | -7.05 | -3.6 | -7.39 | -7.39 | -7.39 | -7.39 | -7.39 |
| Tax Rate, % | 3.92 | 3.92 | 3.92 | 3.92 | 3.92 | 3.92 | 3.92 | 3.92 | 3.92 | 3.92 |
| EBITAT | 2,981.9 | 3,717.0 | 2,464.4 | 1,225.3 | 2,703.7 | 3,745.0 | 4,362.5 | 5,081.8 | 5,919.7 | 6,895.8 |
| Depreciation | ||||||||||
| Changes in Account Receivables | ||||||||||
| Changes in Inventories | ||||||||||
| Changes in Accounts Payable | ||||||||||
| Capital Expenditure | ||||||||||
| UFCF | -2,371.7 | -1,420.8 | -620.3 | -6,602.3 | 397.4 | 2,281.1 | -1,714.8 | -1,997.5 | -2,326.9 | -2,710.5 |
| WACC, % | 6.73 | 6.76 | 6.79 | 6.79 | 6.77 | 6.77 | 6.77 | 6.77 | 6.77 | 6.77 |
| PV UFCF | ||||||||||
| SUM PV UFCF | -4,753.1 | |||||||||
| Long Term Growth Rate, % | 3.00 | |||||||||
| Free cash flow (T + 1) | -2,792 | |||||||||
| Terminal Value | -74,077 | |||||||||
| Present Terminal Value | -53,390 | |||||||||
| Enterprise Value | -58,143 | |||||||||
| Net Debt | -7,743 | |||||||||
| Equity Value | -50,400 | |||||||||
| Diluted Shares Outstanding, MM | 3,417 | |||||||||
| Equity Value Per Share | -14.75 |
What You'll Receive
- Editable Excel Template: A fully customizable Excel-based DCF Calculator featuring pre-populated financial data for Goertek Inc. (002241SZ).
- Real-World Data: Access to historical metrics and forward-looking projections (highlighted in the yellow cells).
- Forecast Flexibility: Adjust forecast parameters such as revenue growth, EBITDA percentage, and WACC.
- Automatic Calculations: Instantly observe how your inputs affect the valuation of Goertek Inc. (002241SZ).
- Professional Tool: Designed for investors, CFOs, consultants, and financial analysts.
- User-Friendly Design: Organized for clarity and ease of navigation, complete with step-by-step guidance.
Key Features
- Customizable Forecast Inputs: Adjust essential parameters such as revenue growth, EBITDA margin, and capital investments.
- Instant DCF Valuation: Quickly calculates intrinsic value, net present value (NPV), and other financial metrics.
- High-Precision Outputs: Leverages Goertek Inc.'s (002241SZ) real-world financial data for realistic valuation results.
- Effortless Scenario Analysis: Easily explore various assumptions and analyze the resulting impacts.
- Efficiency Enhancement: Streamline your process by bypassing the need to construct intricate valuation models from the ground up.
How It Functions
- 1. Access the Template: Download and open the Excel file containing Goertek Inc.'s preloaded data.
- 2. Adjust Assumptions: Modify essential inputs such as growth rates, WACC, and capital expenditures.
- 3. View Results in Real-Time: The DCF model automatically calculates the intrinsic value and NPV.
- 4. Explore Scenarios: Evaluate multiple forecasts to assess different valuation results.
- 5. Utilize with Assurance: Deliver professional valuation insights to enhance your decision-making.
Why Opt for This Calculator for Goertek Inc. (002241SZ)?
- Reliable Data: Access accurate financial information from Goertek Inc. for dependable valuation outcomes.
- Customizable Options: Tailor essential parameters such as growth rates, WACC, and tax rates according to your forecasts.
- Efficiency Boost: Pre-configured calculations save you time, letting you avoid starting from scratch.
- Professional Quality: Ideal for investors, analysts, and consultants seeking detailed insights.
- User-Friendly Interface: Easy-to-navigate design with clear, step-by-step guidance suitable for all skill levels.
Who Can Benefit from This Product?
- Individual Investors: Make well-informed decisions regarding the purchase or sale of Goertek Inc. (002241SZ) stock.
- Financial Analysts: Enhance valuation workflows with comprehensive financial models at your fingertips.
- Consultants: Provide clients with accurate and timely valuation insights into Goertek Inc. (002241SZ).
- Business Owners: Gain insights into how major firms like Goertek Inc. (002241SZ) are valued to inform your own business strategies.
- Finance Students: Master valuation methodologies using real-world data and case studies related to Goertek Inc. (002241SZ).
Contents of the Template
- Pre-Filled Data: Contains Goertek Inc.'s historical financial information and projections.
- Discounted Cash Flow Model: An editable DCF valuation model featuring automatic calculations.
- Weighted Average Cost of Capital (WACC): A specific sheet designed for calculating WACC using custom inputs.
- Key Financial Ratios: Evaluate Goertek Inc.'s profitability, efficiency, and financial leverage.
- Customizable Inputs: Easily modify revenue growth rates, profit margins, and tax rates.
- Clear Dashboard: Visualizations and tables that summarize essential valuation outcomes.
Disclaimer
All information, articles, and product details provided on this website are for general informational and educational purposes only. We do not claim any ownership over, nor do we intend to infringe upon, any trademarks, copyrights, logos, brand names, or other intellectual property mentioned or depicted on this site. Such intellectual property remains the property of its respective owners, and any references here are made solely for identification or informational purposes, without implying any affiliation, endorsement, or partnership.
We make no representations or warranties, express or implied, regarding the accuracy, completeness, or suitability of any content or products presented. Nothing on this website should be construed as legal, tax, investment, financial, medical, or other professional advice. In addition, no part of this site—including articles or product references—constitutes a solicitation, recommendation, endorsement, advertisement, or offer to buy or sell any securities, franchises, or other financial instruments, particularly in jurisdictions where such activity would be unlawful.
All content is of a general nature and may not address the specific circumstances of any individual or entity. It is not a substitute for professional advice or services. Any actions you take based on the information provided here are strictly at your own risk. You accept full responsibility for any decisions or outcomes arising from your use of this website and agree to release us from any liability in connection with your use of, or reliance upon, the content or products found herein.