
|
Zhefu Holding Group Co. ، Ltd. (002266.SZ) تقييم DCF |
Fully Editable: Tailor To Your Needs In Excel Or Sheets
Professional Design: Trusted, Industry-Standard Templates
Investor-Approved Valuation Models
MAC/PC Compatible, Fully Unlocked
No Expertise Is Needed; Easy To Follow
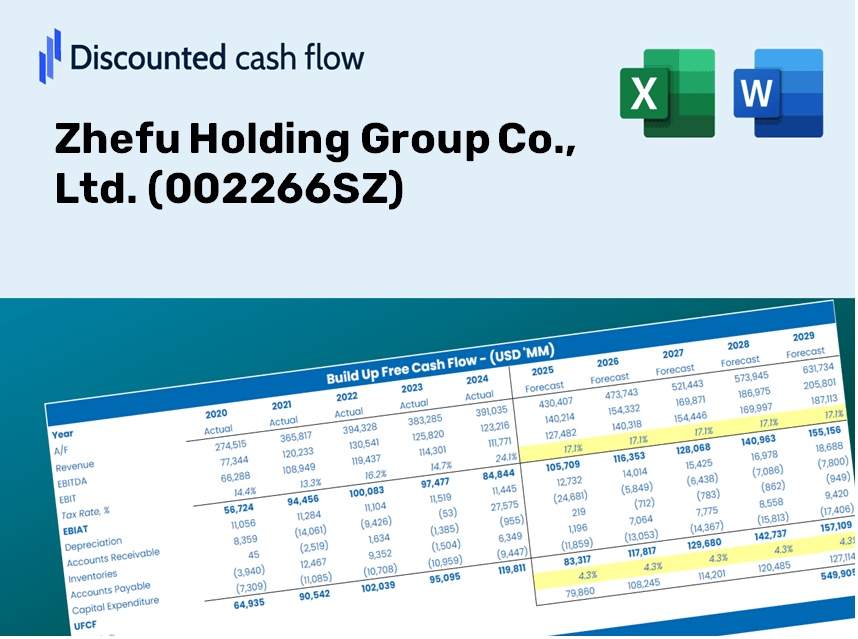
Zhefu Holding Group Co., Ltd. (002266.SZ) Bundle
Gain insight into your Zhefu Holding Group Co., Ltd. (002266SZ) valuation analysis using our sophisticated DCF Calculator! Preloaded with actual (002266SZ) data, this Excel template enables you to adjust forecasts and assumptions for an accurate calculation of Zhefu Holding Group Co., Ltd.'s intrinsic value.
Discounted Cash Flow (DCF) - (USD MM)
| Year | AY1 2020 |
AY2 2021 |
AY3 2022 |
AY4 2023 |
AY5 2024 |
FY1 2025 |
FY2 2026 |
FY3 2027 |
FY4 2028 |
FY5 2029 |
|---|---|---|---|---|---|---|---|---|---|---|
| Revenue | 8,343.4 | 14,153.0 | 16,779.8 | 18,950.8 | 20,911.9 | 26,740.1 | 34,192.4 | 43,721.8 | 55,906.9 | 71,488.1 |
| Revenue Growth, % | 0 | 69.63 | 18.56 | 12.94 | 10.35 | 27.87 | 27.87 | 27.87 | 27.87 | 27.87 |
| EBITDA | 1,950.6 | 2,530.9 | 2,116.9 | 1,405.7 | 1,528.0 | 3,668.9 | 4,691.4 | 5,998.8 | 7,670.7 | 9,808.5 |
| EBITDA, % | 23.38 | 17.88 | 12.62 | 7.42 | 7.31 | 13.72 | 13.72 | 13.72 | 13.72 | 13.72 |
| Depreciation | 271.3 | 378.0 | 454.8 | 514.5 | 530.0 | 742.4 | 949.3 | 1,213.9 | 1,552.2 | 1,984.7 |
| Depreciation, % | 3.25 | 2.67 | 2.71 | 2.71 | 2.53 | 2.78 | 2.78 | 2.78 | 2.78 | 2.78 |
| EBIT | 1,679.3 | 2,152.9 | 1,662.2 | 891.2 | 998.0 | 2,926.5 | 3,742.1 | 4,785.0 | 6,118.5 | 7,823.7 |
| EBIT, % | 20.13 | 15.21 | 9.91 | 4.7 | 4.77 | 10.94 | 10.94 | 10.94 | 10.94 | 10.94 |
| Total Cash | 1,755.4 | 2,978.9 | 5,499.2 | 3,087.2 | 4,759.9 | 6,092.0 | 7,789.8 | 9,960.9 | 12,736.9 | 16,286.7 |
| Total Cash, percent | .0 | .0 | .0 | .0 | .0 | .0 | .0 | .0 | .0 | .0 |
| Account Receivables | 1,253.8 | 1,970.8 | 1,359.8 | 1,389.8 | 1,927.4 | 2,866.9 | 3,665.9 | 4,687.5 | 5,993.9 | 7,664.4 |
| Account Receivables, % | 15.03 | 13.92 | 8.1 | 7.33 | 9.22 | 10.72 | 10.72 | 10.72 | 10.72 | 10.72 |
| Inventories | 4,638.5 | 6,776.0 | 7,541.8 | 8,261.9 | 8,425.3 | 12,423.6 | 15,886.0 | 20,313.4 | 25,974.7 | 33,213.8 |
| Inventories, % | 55.6 | 47.88 | 44.95 | 43.6 | 40.29 | 46.46 | 46.46 | 46.46 | 46.46 | 46.46 |
| Accounts Payable | 2,551.4 | 1,543.5 | 3,301.4 | 4,613.9 | 7,199.7 | 6,414.2 | 8,201.8 | 10,487.7 | 13,410.5 | 17,148.0 |
| Accounts Payable, % | 30.58 | 10.91 | 19.67 | 24.35 | 34.43 | 23.99 | 23.99 | 23.99 | 23.99 | 23.99 |
| Capital Expenditure | -1,435.3 | -1,051.5 | -654.6 | -533.4 | -826.3 | -1,887.8 | -2,413.9 | -3,086.6 | -3,946.9 | -5,046.9 |
| Capital Expenditure, % | -17.2 | -7.43 | -3.9 | -2.81 | -3.95 | -7.06 | -7.06 | -7.06 | -7.06 | -7.06 |
| Tax Rate, % | 10.84 | 10.84 | 10.84 | 10.84 | 10.84 | 10.84 | 10.84 | 10.84 | 10.84 | 10.84 |
| EBITAT | 1,238.4 | 1,993.2 | 1,600.2 | 935.4 | 889.8 | 2,644.1 | 3,381.0 | 4,323.3 | 5,528.2 | 7,068.9 |
| Depreciation | ||||||||||
| Changes in Account Receivables | ||||||||||
| Changes in Inventories | ||||||||||
| Changes in Accounts Payable | ||||||||||
| Capital Expenditure | ||||||||||
| UFCF | -3,266.5 | -2,542.6 | 3,003.5 | 1,479.0 | 2,478.2 | -4,224.5 | -557.4 | -712.7 | -911.4 | -1,165.4 |
| WACC, % | 5.09 | 5.18 | 5.2 | 5.22 | 5.17 | 5.17 | 5.17 | 5.17 | 5.17 | 5.17 |
| PV UFCF | ||||||||||
| SUM PV UFCF | -6,783.8 | |||||||||
| Long Term Growth Rate, % | 2.00 | |||||||||
| Free cash flow (T + 1) | -1,189 | |||||||||
| Terminal Value | -37,470 | |||||||||
| Present Terminal Value | -29,119 | |||||||||
| Enterprise Value | -35,903 | |||||||||
| Net Debt | -1,251 | |||||||||
| Equity Value | -34,652 | |||||||||
| Diluted Shares Outstanding, MM | 5,113 | |||||||||
| Equity Value Per Share | -6.78 |
Your Benefits
- Genuine Zhefu Financial Data: Access to both historical and projected figures for precise valuation.
- Customizable Parameters: Adjust WACC, tax rates, revenue growth, and capital expenditure inputs to fit your analysis.
- Automated Calculations: Intrinsic value and NPV are computed in real-time.
- Scenario Testing: Explore various scenarios to assess Zhefu's future performance.
- User-Friendly Interface: Designed for industry experts while remaining approachable for newcomers.
Highlighted Features
- Comprehensive DCF Calculator: Offers thorough unlevered and levered DCF valuation frameworks tailored for Zhefu Holding Group Co., Ltd. (002266SZ).
- WACC Calculation Tool: An easily adjustable Weighted Average Cost of Capital template with flexible input options.
- Customizable Forecast Inputs: Adjust growth rates, capital expenditures, and discount rates as needed.
- Integrated Financial Ratios: Evaluate profitability, leverage, and efficiency ratios specific to Zhefu Holding Group Co., Ltd. (002266SZ).
- Visual Dashboard and Charts: Graphical representations that encapsulate essential valuation metrics for straightforward assessment.
How It Functions
- Step 1: Download the Excel spreadsheet.
- Step 2: Examine Zhefu Holding Group Co., Ltd.'s pre-filled financial data and projections.
- Step 3: Adjust key inputs such as revenue growth, WACC, and tax rates (highlighted cells).
- Step 4: See the DCF model refresh in real time as you modify your assumptions.
- Step 5: Review the outputs and leverage the results for your investment strategies.
Why Opt for Zhefu Holding Group Co., Ltd. (002266SZ)?
- Save Time: Skip the hassle of building your financial models; our resources are ready to utilize.
- Enhance Accuracy: Our dependable financial insights and methodologies minimize valuation errors.
- Completely Customizable: Adjust the model to align with your specific assumptions and forecasts.
- User-Friendly: Intuitive graphs and outputs simplify the analysis of your results.
- Endorsed by Professionals: Created for those who prioritize precision and ease of use in financial assessments.
Who Should Consider Using This Product?
- Investors: Evaluate Zhefu Holding Group's valuation before making stock transactions.
- CFOs and Financial Analysts: Optimize valuation methodologies and assess financial projections.
- Startup Founders: Gain insights into how established companies like Zhefu Holding Group are valued.
- Consultants: Create comprehensive valuation reports for your clients focused on Zhefu Holding Group (002266SZ).
- Students and Educators: Utilize real market data to learn and teach valuation practices.
Contents of the Template
- Detailed DCF Model: Fully editable template featuring in-depth valuation calculations.
- Historical and Projected Data: Zhefu Holding Group Co., Ltd.'s (002266SZ) financials preloaded for thorough analysis.
- Adjustable Inputs: Modify WACC, growth rates, and tax assumptions to explore various scenarios.
- Comprehensive Financial Statements: Annual and quarterly breakdowns for more profound insights.
- Essential Ratios: Integrated analysis of profitability, efficiency, and leverage metrics.
- Interactive Dashboard with Visual Outputs: Graphs and tables providing clear and actionable insights.
Disclaimer
All information, articles, and product details provided on this website are for general informational and educational purposes only. We do not claim any ownership over, nor do we intend to infringe upon, any trademarks, copyrights, logos, brand names, or other intellectual property mentioned or depicted on this site. Such intellectual property remains the property of its respective owners, and any references here are made solely for identification or informational purposes, without implying any affiliation, endorsement, or partnership.
We make no representations or warranties, express or implied, regarding the accuracy, completeness, or suitability of any content or products presented. Nothing on this website should be construed as legal, tax, investment, financial, medical, or other professional advice. In addition, no part of this site—including articles or product references—constitutes a solicitation, recommendation, endorsement, advertisement, or offer to buy or sell any securities, franchises, or other financial instruments, particularly in jurisdictions where such activity would be unlawful.
All content is of a general nature and may not address the specific circumstances of any individual or entity. It is not a substitute for professional advice or services. Any actions you take based on the information provided here are strictly at your own risk. You accept full responsibility for any decisions or outcomes arising from your use of this website and agree to release us from any liability in connection with your use of, or reliance upon, the content or products found herein.