
|
شركة Zhejiang Asia-Pacific Mechanical & شركة Electronic Co.، Ltd (002284.SZ) تقييم DCF |
Fully Editable: Tailor To Your Needs In Excel Or Sheets
Professional Design: Trusted, Industry-Standard Templates
Investor-Approved Valuation Models
MAC/PC Compatible, Fully Unlocked
No Expertise Is Needed; Easy To Follow
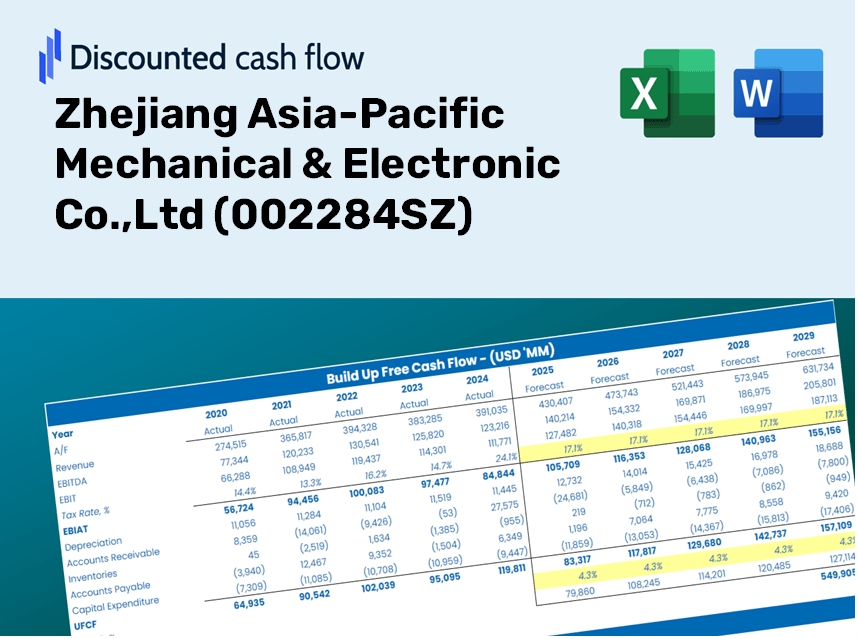
Zhejiang Asia-Pacific Mechanical & Electronic Co.,Ltd (002284.SZ) Bundle
Explore the financial prospects of Zhejiang Asia-Pacific Mechanical & Electronic Co., Ltd with our user-friendly DCF Calculator! Enter your projections for growth, margins, and expenses to calculate the intrinsic value of Zhejiang Asia-Pacific Mechanical & Electronic Co., Ltd and inform your investment decisions.
Discounted Cash Flow (DCF) - (USD MM)
| Year | AY1 2020 |
AY2 2021 |
AY3 2022 |
AY4 2023 |
AY5 2024 |
FY1 2025 |
FY2 2026 |
FY3 2027 |
FY4 2028 |
FY5 2029 |
|---|---|---|---|---|---|---|---|---|---|---|
| Revenue | 2,921.0 | 3,630.6 | 3,749.9 | 3,874.4 | 4,260.4 | 4,695.6 | 5,175.3 | 5,703.9 | 6,286.6 | 6,928.8 |
| Revenue Growth, % | 0 | 24.29 | 3.29 | 3.32 | 9.96 | 10.22 | 10.22 | 10.22 | 10.22 | 10.22 |
| EBITDA | 302.0 | 323.8 | 358.1 | 451.0 | 483.8 | 486.5 | 536.2 | 591.0 | 651.3 | 717.9 |
| EBITDA, % | 10.34 | 8.92 | 9.55 | 11.64 | 11.36 | 10.36 | 10.36 | 10.36 | 10.36 | 10.36 |
| Depreciation | 219.3 | 209.0 | 221.0 | 225.3 | 237.3 | 286.8 | 316.1 | 348.4 | 384.0 | 423.2 |
| Depreciation, % | 7.51 | 5.76 | 5.89 | 5.81 | 5.57 | 6.11 | 6.11 | 6.11 | 6.11 | 6.11 |
| EBIT | 82.7 | 114.8 | 137.1 | 225.7 | 246.5 | 199.7 | 220.1 | 242.6 | 267.3 | 294.6 |
| EBIT, % | 2.83 | 3.16 | 3.66 | 5.83 | 5.79 | 4.25 | 4.25 | 4.25 | 4.25 | 4.25 |
| Total Cash | 1,565.6 | 1,569.8 | 2,527.2 | 2,358.0 | 3,131.0 | 2,804.1 | 3,090.5 | 3,406.2 | 3,754.1 | 4,137.6 |
| Total Cash, percent | .0 | .0 | .0 | .0 | .0 | .0 | .0 | .0 | .0 | .0 |
| Account Receivables | 1,028.2 | 905.0 | 909.2 | 1,047.4 | 1,113.7 | 1,291.7 | 1,423.7 | 1,569.1 | 1,729.4 | 1,906.1 |
| Account Receivables, % | 35.2 | 24.93 | 24.25 | 27.03 | 26.14 | 27.51 | 27.51 | 27.51 | 27.51 | 27.51 |
| Inventories | 595.9 | 647.6 | 785.9 | 794.0 | 775.2 | 919.3 | 1,013.2 | 1,116.6 | 1,230.7 | 1,356.4 |
| Inventories, % | 20.4 | 17.84 | 20.96 | 20.49 | 18.2 | 19.58 | 19.58 | 19.58 | 19.58 | 19.58 |
| Accounts Payable | 1,531.5 | 1,657.8 | 1,652.2 | 1,873.5 | 2,322.5 | 2,301.0 | 2,536.1 | 2,795.1 | 3,080.7 | 3,395.4 |
| Accounts Payable, % | 52.43 | 45.66 | 44.06 | 48.36 | 54.51 | 49 | 49 | 49 | 49 | 49 |
| Capital Expenditure | -100.4 | -134.9 | -197.3 | -182.8 | -198.7 | -204.7 | -225.6 | -248.6 | -274.0 | -302.0 |
| Capital Expenditure, % | -3.44 | -3.72 | -5.26 | -4.72 | -4.66 | -4.36 | -4.36 | -4.36 | -4.36 | -4.36 |
| Tax Rate, % | 6.19 | 6.19 | 6.19 | 6.19 | 6.19 | 6.19 | 6.19 | 6.19 | 6.19 | 6.19 |
| EBITAT | 63.7 | 98.8 | 127.7 | 218.7 | 231.2 | 178.5 | 196.7 | 216.8 | 239.0 | 263.4 |
| Depreciation | ||||||||||
| Changes in Account Receivables | ||||||||||
| Changes in Inventories | ||||||||||
| Changes in Accounts Payable | ||||||||||
| Capital Expenditure | ||||||||||
| UFCF | 90.0 | 370.5 | 3.5 | 336.2 | 671.3 | -82.8 | 296.5 | 326.7 | 360.1 | 396.9 |
| WACC, % | 7.3 | 7.34 | 7.38 | 7.4 | 7.38 | 7.36 | 7.36 | 7.36 | 7.36 | 7.36 |
| PV UFCF | ||||||||||
| SUM PV UFCF | 993.5 | |||||||||
| Long Term Growth Rate, % | 3.50 | |||||||||
| Free cash flow (T + 1) | 411 | |||||||||
| Terminal Value | 10,646 | |||||||||
| Present Terminal Value | 7,465 | |||||||||
| Enterprise Value | 8,458 | |||||||||
| Net Debt | -133 | |||||||||
| Equity Value | 8,591 | |||||||||
| Diluted Shares Outstanding, MM | 739 | |||||||||
| Equity Value Per Share | 11.62 |
What You Will Receive
- Customizable Excel Template: A fully adjustable Excel-based DCF Calculator featuring pre-populated real financials for Zhejiang Asia-Pacific Mechanical & Electronic Co.,Ltd (002284SZ).
- Authentic Data: Access to historical figures and forward-looking projections (highlighted in the yellow cells).
- Flexible Forecasting: Modify key assumptions such as revenue growth, EBITDA %, and WACC to suit your analysis.
- Instant Calculations: Quickly observe how your inputs influence the valuation of Zhejiang Asia-Pacific Mechanical & Electronic Co.,Ltd (002284SZ).
- Professional Grade Tool: Designed for investors, CFOs, consultants, and financial analysts.
- Intuitive Interface: Organized for simplicity and ease of navigation, complete with step-by-step guidance.
Core Features
- Customizable Forecast Inputs: Adjust essential parameters such as revenue growth, EBITDA %, and capital investments.
- Instant DCF Valuation: Automatically computes intrinsic value, NPV, and additional metrics at the click of a button.
- Precision of Professional Standards: Leverages Zhejiang Asia-Pacific’s actual financial data for accurate valuation results.
- Streamlined Scenario Analysis: Effortlessly explore various assumptions and evaluate their outcomes.
- Efficiency Booster: Avoid the hassle of constructing complex valuation models from the ground up.
How It Works
- Step 1: Download the prebuilt Excel template featuring data for Zhejiang Asia-Pacific Mechanical & Electronic Co., Ltd (002284SZ).
- Step 2: Navigate through the pre-filled sheets to familiarize yourself with the essential metrics.
- Step 3: Revise forecasts and assumptions in the editable yellow cells (WACC, growth, margins) according to your analysis.
- Step 4: Instantly view the updated results, including the intrinsic value of Zhejiang Asia-Pacific Mechanical & Electronic Co., Ltd (002284SZ).
- Step 5: Make data-driven investment decisions or create reports based on the results obtained.
Why Opt for Zhejiang Asia-Pacific Mechanical & Electronic Co.,Ltd (002284SZ)?
- Time-Saving: No need to build a financial model from the ground up – it's ready for immediate use.
- Enhanced Accuracy: Dependable financial insights and formulas minimize valuation errors.
- Completely Customizable: Adjust the model to align with your specific assumptions and forecasts.
- User-Friendly: Intuitive charts and outputs facilitate straightforward analysis of results.
- Expert Approval: Created for professionals who prioritize both precision and functionality.
Who Should Consider This Product?
- Institutional Investors: Create comprehensive and accurate valuation models for analyzing portfolios with Zhejiang Asia-Pacific Mechanical & Electronic Co.,Ltd (002284SZ).
- Corporate Finance Departments: Examine valuation scenarios to inform strategic decision-making within the company.
- Consultants and Financial Advisors: Equip clients with precise valuation insights regarding Zhejiang Asia-Pacific Mechanical & Electronic Co.,Ltd (002284SZ).
- Students and Educators: Utilize real-world data to practice and teach financial modeling techniques.
- Industry Analysts: Gain a deeper understanding of how companies like Zhejiang Asia-Pacific Mechanical & Electronic Co.,Ltd (002284SZ) are priced in the market.
What the Template Contains
- Operating and Balance Sheet Data: Pre-filled historical data and forecasts for Zhejiang Asia-Pacific Mechanical & Electronic Co., Ltd (002284SZ), including revenue, EBITDA, EBIT, and capital expenditures.
- WACC Calculation: A dedicated sheet for calculating the Weighted Average Cost of Capital (WACC), featuring parameters such as Beta, risk-free rate, and share price.
- DCF Valuation (Unlevered and Levered): Customizable Discounted Cash Flow models that display intrinsic value alongside comprehensive calculations.
- Financial Statements: Pre-loaded annual and quarterly financial statements to facilitate thorough analysis.
- Key Ratios: Provides profitability, leverage, and efficiency ratios specific to Zhejiang Asia-Pacific Mechanical & Electronic Co., Ltd (002284SZ).
- Dashboard and Charts: A visual representation of valuation outcomes and assumptions for easier result analysis.
Disclaimer
All information, articles, and product details provided on this website are for general informational and educational purposes only. We do not claim any ownership over, nor do we intend to infringe upon, any trademarks, copyrights, logos, brand names, or other intellectual property mentioned or depicted on this site. Such intellectual property remains the property of its respective owners, and any references here are made solely for identification or informational purposes, without implying any affiliation, endorsement, or partnership.
We make no representations or warranties, express or implied, regarding the accuracy, completeness, or suitability of any content or products presented. Nothing on this website should be construed as legal, tax, investment, financial, medical, or other professional advice. In addition, no part of this site—including articles or product references—constitutes a solicitation, recommendation, endorsement, advertisement, or offer to buy or sell any securities, franchises, or other financial instruments, particularly in jurisdictions where such activity would be unlawful.
All content is of a general nature and may not address the specific circumstances of any individual or entity. It is not a substitute for professional advice or services. Any actions you take based on the information provided here are strictly at your own risk. You accept full responsibility for any decisions or outcomes arising from your use of this website and agree to release us from any liability in connection with your use of, or reliance upon, the content or products found herein.