
|
GEM Co. ، Ltd. (002340.SZ) تقييم DCF |
Fully Editable: Tailor To Your Needs In Excel Or Sheets
Professional Design: Trusted, Industry-Standard Templates
Investor-Approved Valuation Models
MAC/PC Compatible, Fully Unlocked
No Expertise Is Needed; Easy To Follow
GEM Co., Ltd. (002340.SZ) Bundle
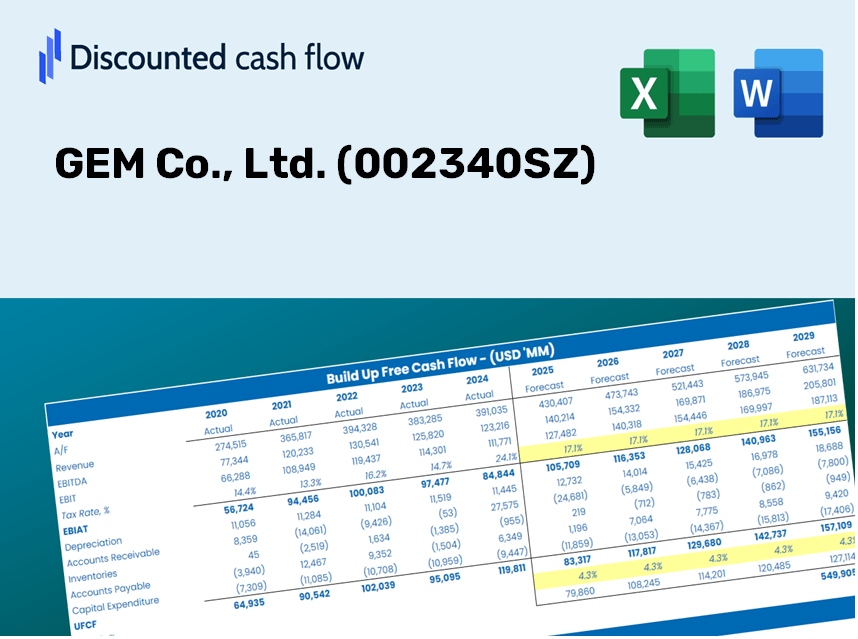
Enhance your investment strategies with the GEM Co., Ltd. (002340SZ) DCF Calculator! Utilize actual GEM financial data, adjust growth estimates and expenses, and observe how these modifications immediately affect the intrinsic value of GEM Co., Ltd. (002340SZ).
Discounted Cash Flow (DCF) - (USD MM)
| Year | AY1 2020 |
AY2 2021 |
AY3 2022 |
AY4 2023 |
AY5 2024 |
FY1 2025 |
FY2 2026 |
FY3 2027 |
FY4 2028 |
FY5 2029 |
|---|---|---|---|---|---|---|---|---|---|---|
| Revenue | 12,466.3 | 19,301.0 | 29,391.8 | 30,528.6 | 33,199.8 | 43,136.9 | 56,048.3 | 72,824.2 | 94,621.3 | 122,942.5 |
| Revenue Growth, % | 0 | 54.83 | 52.28 | 3.87 | 8.75 | 29.93 | 29.93 | 29.93 | 29.93 | 29.93 |
| EBITDA | 1,733.1 | 2,516.3 | 2,975.0 | 2,000.6 | 4,492.4 | 4,930.2 | 6,405.8 | 8,323.2 | 10,814.4 | 14,051.3 |
| EBITDA, % | 13.9 | 13.04 | 10.12 | 6.55 | 13.53 | 11.43 | 11.43 | 11.43 | 11.43 | 11.43 |
| Depreciation | 812.0 | 916.4 | 1,073.1 | 1,385.7 | 1,838.5 | 2,155.9 | 2,801.2 | 3,639.6 | 4,729.0 | 6,144.4 |
| Depreciation, % | 6.51 | 4.75 | 3.65 | 4.54 | 5.54 | 5 | 5 | 5 | 5 | 5 |
| EBIT | 921.1 | 1,599.8 | 1,902.0 | 614.9 | 2,653.9 | 2,774.3 | 3,604.7 | 4,683.6 | 6,085.5 | 7,906.9 |
| EBIT, % | 7.39 | 8.29 | 6.47 | 2.01 | 7.99 | 6.43 | 6.43 | 6.43 | 6.43 | 6.43 |
| Total Cash | 4,423.1 | 3,682.8 | 5,354.0 | 5,543.5 | 4,738.5 | 9,076.8 | 11,793.5 | 15,323.5 | 19,910.0 | 25,869.3 |
| Total Cash, percent | .0 | .0 | .0 | .0 | .0 | .0 | .0 | .0 | .0 | .0 |
| Account Receivables | 3,102.5 | 4,689.7 | 6,083.4 | 8,188.8 | 8,475.6 | 10,545.6 | 13,702.1 | 17,803.3 | 23,132.0 | 30,055.6 |
| Account Receivables, % | 24.89 | 24.3 | 20.7 | 26.82 | 25.53 | 24.45 | 24.45 | 24.45 | 24.45 | 24.45 |
| Inventories | 5,812.7 | 6,264.9 | 7,662.5 | 8,296.8 | 8,773.3 | 13,696.8 | 17,796.4 | 23,123.0 | 30,044.0 | 39,036.5 |
| Inventories, % | 46.63 | 32.46 | 26.07 | 27.18 | 26.43 | 31.75 | 31.75 | 31.75 | 31.75 | 31.75 |
| Accounts Payable | 3,847.8 | 4,272.9 | 3,932.3 | 1,714.4 | 6,916.2 | 8,008.9 | 10,406.0 | 13,520.6 | 17,567.5 | 22,825.7 |
| Accounts Payable, % | 30.87 | 22.14 | 13.38 | 5.62 | 20.83 | 18.57 | 18.57 | 18.57 | 18.57 | 18.57 |
| Capital Expenditure | -1,425.6 | -3,169.4 | -4,132.8 | -5,395.2 | -11,937.9 | -8,243.3 | -10,710.7 | -13,916.5 | -18,081.8 | -23,493.9 |
| Capital Expenditure, % | -11.44 | -16.42 | -14.06 | -17.67 | -35.96 | -19.11 | -19.11 | -19.11 | -19.11 | -19.11 |
| Tax Rate, % | 36.95 | 36.95 | 36.95 | 36.95 | 36.95 | 36.95 | 36.95 | 36.95 | 36.95 | 36.95 |
| EBITAT | 710.3 | 1,281.5 | 1,593.0 | 422.3 | 1,673.3 | 2,067.9 | 2,686.8 | 3,491.1 | 4,536.0 | 5,893.6 |
| Depreciation | ||||||||||
| Changes in Account Receivables | ||||||||||
| Changes in Inventories | ||||||||||
| Changes in Accounts Payable | ||||||||||
| Capital Expenditure | ||||||||||
| UFCF | -4,970.6 | -2,586.0 | -4,598.6 | -8,544.9 | -3,987.6 | -9,920.4 | -10,081.5 | -13,099.0 | -17,019.7 | -22,113.9 |
| WACC, % | 6.18 | 6.21 | 6.26 | 6.08 | 6.01 | 6.15 | 6.15 | 6.15 | 6.15 | 6.15 |
| PV UFCF | ||||||||||
| SUM PV UFCF | -59,064.0 | |||||||||
| Long Term Growth Rate, % | 2.00 | |||||||||
| Free cash flow (T + 1) | -22,556 | |||||||||
| Terminal Value | -543,943 | |||||||||
| Present Terminal Value | -403,663 | |||||||||
| Enterprise Value | -462,727 | |||||||||
| Net Debt | 14,664 | |||||||||
| Equity Value | -477,391 | |||||||||
| Diluted Shares Outstanding, MM | 5,102 | |||||||||
| Equity Value Per Share | -93.57 |
What You Will Receive
- Authentic GEM Co. Data: Comprehensive financials – from revenue to EBIT – featuring actual and projected data.
- Complete Customization: Modify all essential parameters (yellow cells) such as WACC, growth %, and tax rates.
- Immediate Valuation Updates: Automatic recalculations for assessing the effect of changes on GEM Co.'s fair value.
- Flexible Excel Template: Designed for easy modifications, scenario analysis, and thorough projections.
- Efficient and Precise: Eliminate the need to build models from the ground up while ensuring accuracy and adaptability.
Key Features
- Comprehensive DCF Tool: Offers in-depth unlevered and levered discounted cash flow models for precise valuation.
- WACC Toolkit: Features a pre-configured Weighted Average Cost of Capital sheet with adjustable parameters.
- Customizable Forecast Variables: Tailor growth projections, capital expenses, and discount rates to fit your analysis.
- Integrated Financial Ratios: Assess profitability, leverage, and efficiency metrics specifically for GEM Co., Ltd. (002340SZ).
- Interactive Dashboard and Visuals: Provides graphical representations of essential valuation indicators for straightforward interpretation.
How It Operates
- Download the Template: Gain immediate access to the Excel-based GEM Co., Ltd. (002340SZ) DCF Calculator.
- Input Your Assumptions: Modify the yellow-highlighted cells for growth rates, WACC, profit margins, and additional factors.
- Instant Calculations: The model will automatically refresh to display GEM Co., Ltd.'s intrinsic value.
- Test Scenarios: Experiment with various assumptions to assess potential changes in valuation.
- Analyze and Decide: Utilize the findings to inform your investment strategy or financial evaluation.
Why Choose GEM Co., Ltd. (002340SZ) Calculator?
- Time-Efficient: Skip the hassle of building a DCF model from the ground up – it's pre-configured for your convenience.
- Enhanced Accuracy: Dependable financial data and established formulas minimize valuation errors.
- Completely Customizable: Adjust the model to align with your unique assumptions and forecasts.
- User-Friendly: Intuitive charts and outputs simplify the analysis of results.
- Endorsed by Professionals: Crafted for experts who prioritize accuracy and functionality.
Who Can Benefit from GEM Co., Ltd. (002340SZ)?
- Investors: Assess GEM Co., Ltd.’s valuation before making stock transactions.
- CFOs and Financial Analysts: Enhance valuation procedures and evaluate financial forecasts.
- Startup Founders: Discover the valuation strategies employed by leading companies like GEM Co., Ltd.
- Consultants: Create comprehensive valuation reports for your clients.
- Students and Educators: Utilize real-time data to engage in and teach valuation methodologies.
Contents of the Template
- Preloaded GEM Co. Data: Historical and projected financial data, including revenue, EBIT, and capital expenditures.
- DCF and WACC Models: Professional-grade sheets for calculating intrinsic value and Weighted Average Cost of Capital.
- Editable Inputs: Yellow-highlighted cells for modifying revenue growth, tax rates, and discount rates.
- Financial Statements: Detailed annual and quarterly financials for in-depth analysis.
- Key Ratios: Metrics for profitability, leverage, and efficiency to assess performance.
- Dashboard and Charts: Visual representations of valuation results and underlying assumptions.
Disclaimer
All information, articles, and product details provided on this website are for general informational and educational purposes only. We do not claim any ownership over, nor do we intend to infringe upon, any trademarks, copyrights, logos, brand names, or other intellectual property mentioned or depicted on this site. Such intellectual property remains the property of its respective owners, and any references here are made solely for identification or informational purposes, without implying any affiliation, endorsement, or partnership.
We make no representations or warranties, express or implied, regarding the accuracy, completeness, or suitability of any content or products presented. Nothing on this website should be construed as legal, tax, investment, financial, medical, or other professional advice. In addition, no part of this site—including articles or product references—constitutes a solicitation, recommendation, endorsement, advertisement, or offer to buy or sell any securities, franchises, or other financial instruments, particularly in jurisdictions where such activity would be unlawful.
All content is of a general nature and may not address the specific circumstances of any individual or entity. It is not a substitute for professional advice or services. Any actions you take based on the information provided here are strictly at your own risk. You accept full responsibility for any decisions or outcomes arising from your use of this website and agree to release us from any liability in connection with your use of, or reliance upon, the content or products found herein.