
|
شركة Shenzhen Fastprint Circuit Tech Co.، Ltd. (002436.SZ) تقييم DCF |
Fully Editable: Tailor To Your Needs In Excel Or Sheets
Professional Design: Trusted, Industry-Standard Templates
Investor-Approved Valuation Models
MAC/PC Compatible, Fully Unlocked
No Expertise Is Needed; Easy To Follow
Shenzhen Fastprint Circuit Tech Co., Ltd. (002436.SZ) Bundle
Streamline your analysis and improve precision with our (002436SZ) DCF Calculator! Equipped with genuine data from Shenzhen Fastprint Circuit Tech Co., Ltd. and customizable assumptions, this tool enables you to forecast, analyze, and value Shenzhen Fastprint like a seasoned investor.
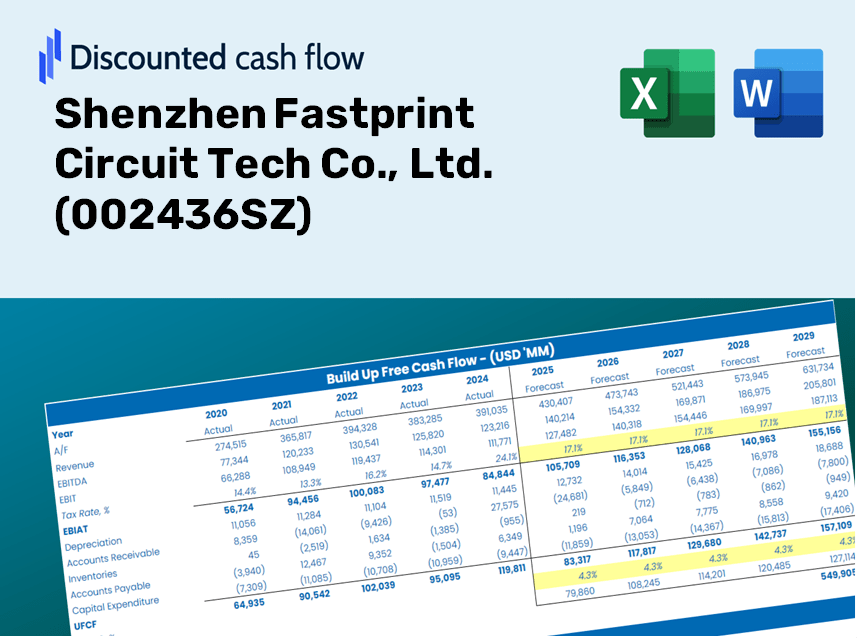
Discounted Cash Flow (DCF) - (USD MM)
| Year | AY1 2020 |
AY2 2021 |
AY3 2022 |
AY4 2023 |
AY5 2024 |
FY1 2025 |
FY2 2026 |
FY3 2027 |
FY4 2028 |
FY5 2029 |
|---|---|---|---|---|---|---|---|---|---|---|
| Revenue | 4,034.7 | 5,040.0 | 5,353.9 | 5,359.9 | 5,817.3 | 6,396.0 | 7,032.3 | 7,731.9 | 8,501.1 | 9,346.7 |
| Revenue Growth, % | 0 | 24.92 | 6.23 | 0.11336 | 8.53 | 9.95 | 9.95 | 9.95 | 9.95 | 9.95 |
| EBITDA | 666.9 | 916.1 | 686.0 | 361.1 | 171.0 | 731.6 | 804.4 | 884.4 | 972.4 | 1,069.2 |
| EBITDA, % | 16.53 | 18.18 | 12.81 | 6.74 | 2.94 | 11.44 | 11.44 | 11.44 | 11.44 | 11.44 |
| Depreciation | 199.0 | 211.7 | 251.1 | 366.1 | 551.0 | 385.3 | 423.7 | 465.8 | 512.2 | 563.1 |
| Depreciation, % | 4.93 | 4.2 | 4.69 | 6.83 | 9.47 | 6.02 | 6.02 | 6.02 | 6.02 | 6.02 |
| EBIT | 468.0 | 704.4 | 434.9 | -5.0 | -380.0 | 346.3 | 380.7 | 418.6 | 460.3 | 506.1 |
| EBIT, % | 11.6 | 13.98 | 8.12 | -0.09365446 | -6.53 | 5.41 | 5.41 | 5.41 | 5.41 | 5.41 |
| Total Cash | 901.9 | 1,244.1 | 1,411.5 | 2,415.5 | 884.6 | 1,710.0 | 1,880.1 | 2,067.1 | 2,272.8 | 2,498.9 |
| Total Cash, percent | .0 | .0 | .0 | .0 | .0 | .0 | .0 | .0 | .0 | .0 |
| Account Receivables | 1,512.2 | 1,977.4 | 2,062.5 | 2,757.7 | 2,207.0 | 2,617.6 | 2,878.0 | 3,164.3 | 3,479.1 | 3,825.2 |
| Account Receivables, % | 37.48 | 39.23 | 38.52 | 51.45 | 37.94 | 40.93 | 40.93 | 40.93 | 40.93 | 40.93 |
| Inventories | 399.2 | 671.1 | 731.7 | 632.9 | 771.0 | 792.3 | 871.1 | 957.8 | 1,053.0 | 1,157.8 |
| Inventories, % | 9.89 | 13.31 | 13.67 | 11.81 | 13.25 | 12.39 | 12.39 | 12.39 | 12.39 | 12.39 |
| Accounts Payable | 712.0 | 1,056.3 | 1,105.3 | 1,622.7 | 1,766.1 | 1,533.6 | 1,686.1 | 1,853.9 | 2,038.3 | 2,241.1 |
| Accounts Payable, % | 17.65 | 20.96 | 20.65 | 30.27 | 30.36 | 23.98 | 23.98 | 23.98 | 23.98 | 23.98 |
| Capital Expenditure | -481.6 | -1,075.3 | -2,368.7 | -1,881.2 | -1,127.9 | -1,688.6 | -1,856.6 | -2,041.3 | -2,244.3 | -2,467.6 |
| Capital Expenditure, % | -11.94 | -21.34 | -44.24 | -35.1 | -19.39 | -26.4 | -26.4 | -26.4 | -26.4 | -26.4 |
| Tax Rate, % | 65.51 | 65.51 | 65.51 | 65.51 | 65.51 | 65.51 | 65.51 | 65.51 | 65.51 | 65.51 |
| EBITAT | 401.1 | 654.0 | 456.1 | -31.9 | -131.1 | 286.1 | 314.5 | 345.8 | 380.2 | 418.1 |
| Depreciation | ||||||||||
| Changes in Account Receivables | ||||||||||
| Changes in Inventories | ||||||||||
| Changes in Accounts Payable | ||||||||||
| Capital Expenditure | ||||||||||
| UFCF | -1,080.9 | -602.5 | -1,758.3 | -1,625.9 | -152.0 | -1,681.6 | -1,305.0 | -1,434.8 | -1,577.6 | -1,734.5 |
| WACC, % | 4.56 | 4.59 | 4.62 | 4.62 | 4.31 | 4.54 | 4.54 | 4.54 | 4.54 | 4.54 |
| PV UFCF | ||||||||||
| SUM PV UFCF | -6,768.5 | |||||||||
| Long Term Growth Rate, % | 4.00 | |||||||||
| Free cash flow (T + 1) | -1,804 | |||||||||
| Terminal Value | -333,410 | |||||||||
| Present Terminal Value | -267,021 | |||||||||
| Enterprise Value | -273,789 | |||||||||
| Net Debt | 2,433 | |||||||||
| Equity Value | -276,223 | |||||||||
| Diluted Shares Outstanding, MM | 1,652 | |||||||||
| Equity Value Per Share | -167.16 |
Benefits You'll Receive
- Comprehensive Financial Model: Leveraging Shenzhen Fastprint Circuit Tech Co., Ltd.'s (002436SZ) actual data for accurate DCF valuations.
- Complete Forecast Flexibility: Modify revenue growth, profit margins, WACC, and other critical drivers to match your analysis.
- Real-Time Calculations: Automated updates ensure that you can view results instantly as you make adjustments.
- Professional-Grade Template: A polished Excel file crafted for high-quality valuation presentations.
- Adaptable and Reusable: Designed with flexibility in mind, allowing for repeated use in detailed forecasting.
Key Features
- Comprehensive DCF Calculator: Features thorough unlevered and levered DCF valuation models tailored for Shenzhen Fastprint Circuit Tech Co., Ltd. (002436SZ).
- WACC Calculator: Ready-to-use Weighted Average Cost of Capital sheet with adjustable input parameters.
- Customizable Forecast Assumptions: Adjust growth projections, capital expenditures, and discount rates to suit your analysis.
- Integrated Financial Ratios: Evaluate profitability, leverage, and efficiency ratios specific to Shenzhen Fastprint Circuit Tech Co., Ltd. (002436SZ).
- Visual Dashboard and Charts: Graphical representations provide a clear overview of key valuation metrics for streamlined analysis.
How It Operates
- Step 1: Download the Excel file.
- Step 2: Examine Shenzhen Fastprint Circuit Tech Co., Ltd.'s (002436SZ) pre-filled financial data and projections.
- Step 3: Adjust key parameters such as revenue growth, WACC, and tax rates (highlighted cells).
- Step 4: Observe the DCF model refresh in real-time as you modify assumptions.
- Step 5: Evaluate the outputs and leverage the findings for your investment strategies.
Why Opt for This Calculator?
- All-in-One Solution: Consolidates DCF, WACC, and financial ratio analyses into a single tool.
- Flexible Adjustments: Modify the yellow-highlighted cells to explore different scenarios.
- In-Depth Analysis: Automatically determines Shenzhen Fastprint Circuit Tech Co., Ltd.'s intrinsic value and Net Present Value.
- Preloaded Information: Access historical and projected data for reliable starting points.
- High-Quality Standards: Perfect for financial analysts, investors, and business consultants.
Who Can Benefit from Shenzhen Fastprint Circuit Tech Co., Ltd. (002436SZ)?
- Investors: Make informed investment choices with a reliable valuation tool tailored for professionals.
- Financial Analysts: Streamline your workflow with a customizable DCF model that’s ready to use.
- Consultants: Easily modify the template for impactful presentations or client reports.
- Finance Enthusiasts: Enhance your knowledge of valuation methods through practical, real-world applications.
- Educators and Students: Utilize this resource as an effective learning aid in finance courses.
What the Template Contains
- Operating and Balance Sheet Data: Pre-filled historical data and forecasts for Shenzhen Fastprint Circuit Tech Co., Ltd. (002436SZ), including revenue, EBITDA, EBIT, and capital expenditures.
- WACC Calculation: A dedicated sheet for Weighted Average Cost of Capital (WACC), with parameters such as Beta, risk-free rate, and share price.
- DCF Valuation (Unlevered and Levered): Editable Discounted Cash Flow models showcasing intrinsic value along with detailed calculations.
- Financial Statements: Pre-loaded annual and quarterly financial statements to aid in analysis.
- Key Ratios: Includes profitability, leverage, and efficiency ratios for Shenzhen Fastprint Circuit Tech Co., Ltd. (002436SZ).
- Dashboard and Charts: Visual summaries of valuation outputs and assumptions, facilitating easy analysis of results.
Disclaimer
All information, articles, and product details provided on this website are for general informational and educational purposes only. We do not claim any ownership over, nor do we intend to infringe upon, any trademarks, copyrights, logos, brand names, or other intellectual property mentioned or depicted on this site. Such intellectual property remains the property of its respective owners, and any references here are made solely for identification or informational purposes, without implying any affiliation, endorsement, or partnership.
We make no representations or warranties, express or implied, regarding the accuracy, completeness, or suitability of any content or products presented. Nothing on this website should be construed as legal, tax, investment, financial, medical, or other professional advice. In addition, no part of this site—including articles or product references—constitutes a solicitation, recommendation, endorsement, advertisement, or offer to buy or sell any securities, franchises, or other financial instruments, particularly in jurisdictions where such activity would be unlawful.
All content is of a general nature and may not address the specific circumstances of any individual or entity. It is not a substitute for professional advice or services. Any actions you take based on the information provided here are strictly at your own risk. You accept full responsibility for any decisions or outcomes arising from your use of this website and agree to release us from any liability in connection with your use of, or reliance upon, the content or products found herein.