
|
Ofilm Group Co. ، Ltd. (002456.SZ) تقييم DCF |
Fully Editable: Tailor To Your Needs In Excel Or Sheets
Professional Design: Trusted, Industry-Standard Templates
Investor-Approved Valuation Models
MAC/PC Compatible, Fully Unlocked
No Expertise Is Needed; Easy To Follow
OFILM Group Co., Ltd. (002456.SZ) Bundle
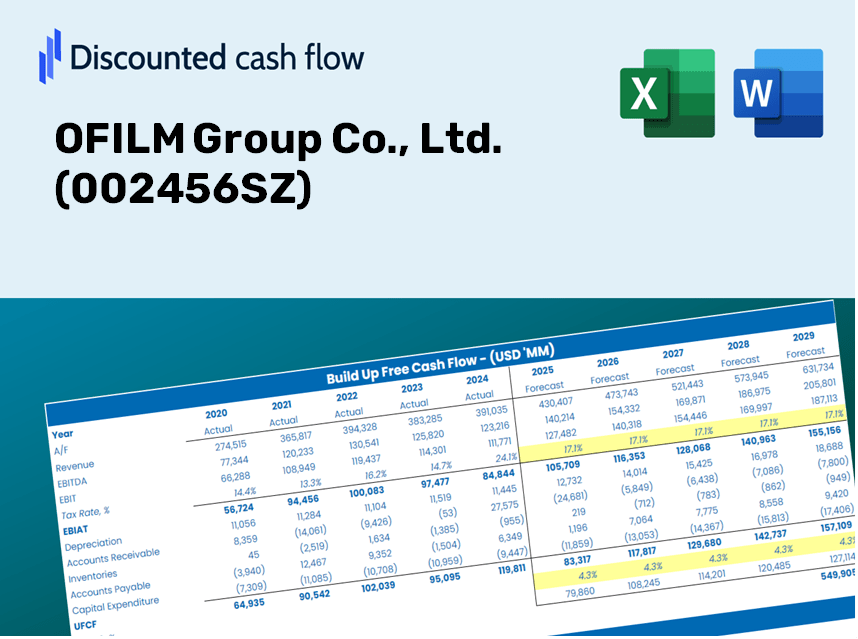
Evaluate OFILM Group Co., Ltd.'s financial outlook like an expert! This (002456SZ) DCF Calculator comes with pre-filled financials and offers full flexibility to modify revenue growth, WACC, margins, and other crucial assumptions to align with your predictions.
Discounted Cash Flow (DCF) - (USD MM)
| Year | AY1 2020 |
AY2 2021 |
AY3 2022 |
AY4 2023 |
AY5 2024 |
FY1 2025 |
FY2 2026 |
FY3 2027 |
FY4 2028 |
FY5 2029 |
|---|---|---|---|---|---|---|---|---|---|---|
| Revenue | 48,349.7 | 22,843.9 | 14,827.2 | 16,862.9 | 20,436.9 | 17,733.0 | 15,386.8 | 13,351.1 | 11,584.7 | 10,051.9 |
| Revenue Growth, % | 0 | -52.75 | -35.09 | 13.73 | 21.19 | -13.23 | -13.23 | -13.23 | -13.23 | -13.23 |
| EBITDA | 3,453.0 | 17.0 | -2,504.8 | 707.5 | 1,223.2 | 17.9 | 15.5 | 13.4 | 11.7 | 10.1 |
| EBITDA, % | 7.14 | 0.07442549 | -16.89 | 4.2 | 5.99 | 0.10073 | 0.10073 | 0.10073 | 0.10073 | 0.10073 |
| Depreciation | 1,861.3 | 1,234.7 | 844.0 | 774.9 | 730.7 | 819.9 | 711.4 | 617.3 | 535.6 | 464.8 |
| Depreciation, % | 3.85 | 5.4 | 5.69 | 4.6 | 3.58 | 4.62 | 4.62 | 4.62 | 4.62 | 4.62 |
| EBIT | 1,591.7 | -1,217.7 | -3,348.8 | -67.5 | 492.5 | -802.0 | -695.9 | -603.8 | -523.9 | -454.6 |
| EBIT, % | 3.29 | -5.33 | -22.59 | -0.4002 | 2.41 | -4.52 | -4.52 | -4.52 | -4.52 | -4.52 |
| Total Cash | 3,371.6 | 3,628.5 | 3,240.5 | 1,574.5 | 1,171.7 | 2,120.2 | 1,839.7 | 1,596.3 | 1,385.1 | 1,201.9 |
| Total Cash, percent | .0 | .0 | .0 | .0 | .0 | .0 | .0 | .0 | .0 | .0 |
| Account Receivables | 11,500.9 | 7,328.2 | 4,594.8 | 6,526.9 | 8,582.0 | 5,942.4 | 5,156.2 | 4,474.0 | 3,882.1 | 3,368.5 |
| Account Receivables, % | 23.79 | 32.08 | 30.99 | 38.71 | 41.99 | 33.51 | 33.51 | 33.51 | 33.51 | 33.51 |
| Inventories | 4,947.2 | 3,513.0 | 2,222.2 | 2,514.3 | 3,393.9 | 2,557.6 | 2,219.2 | 1,925.6 | 1,670.8 | 1,449.8 |
| Inventories, % | 10.23 | 15.38 | 14.99 | 14.91 | 16.61 | 14.42 | 14.42 | 14.42 | 14.42 | 14.42 |
| Accounts Payable | 8,729.0 | 4,913.3 | 4,239.4 | 6,368.0 | 8,325.6 | 5,201.3 | 4,513.1 | 3,916.0 | 3,397.9 | 2,948.4 |
| Accounts Payable, % | 18.05 | 21.51 | 28.59 | 37.76 | 40.74 | 29.33 | 29.33 | 29.33 | 29.33 | 29.33 |
| Capital Expenditure | -1,584.6 | -878.7 | -725.7 | -303.4 | -502.0 | -577.1 | -500.8 | -434.5 | -377.0 | -327.2 |
| Capital Expenditure, % | -3.28 | -3.85 | -4.89 | -1.8 | -2.46 | -3.25 | -3.25 | -3.25 | -3.25 | -3.25 |
| Tax Rate, % | 30.2 | 30.2 | 30.2 | 30.2 | 30.2 | 30.2 | 30.2 | 30.2 | 30.2 | 30.2 |
| EBITAT | 1,748.3 | -1,168.8 | -3,101.3 | -878.8 | 343.8 | -735.3 | -638.0 | -553.6 | -480.3 | -416.8 |
| Depreciation | ||||||||||
| Changes in Account Receivables | ||||||||||
| Changes in Inventories | ||||||||||
| Changes in Accounts Payable | ||||||||||
| Capital Expenditure | ||||||||||
| UFCF | -5,694.0 | 978.4 | 367.2 | -502.8 | -404.7 | -141.0 | 9.1 | 7.9 | 6.8 | 5.9 |
| WACC, % | 4.86 | 4.83 | 4.81 | 4.86 | 4.63 | 4.8 | 4.8 | 4.8 | 4.8 | 4.8 |
| PV UFCF | ||||||||||
| SUM PV UFCF | -109.1 | |||||||||
| Long Term Growth Rate, % | 2.00 | |||||||||
| Free cash flow (T + 1) | 6 | |||||||||
| Terminal Value | 216 | |||||||||
| Present Terminal Value | 171 | |||||||||
| Enterprise Value | 62 | |||||||||
| Net Debt | 3,366 | |||||||||
| Equity Value | -3,305 | |||||||||
| Diluted Shares Outstanding, MM | 3,298 | |||||||||
| Equity Value Per Share | -1.00 |
What You Will Receive
- Authentic OFILM Data: Comprehensive financials – encompassing everything from revenue to EBIT – derived from actual and forecasted statistics.
- Complete Customization: Modify all essential parameters (yellow cells) such as WACC, growth %, and tax rates.
- Immediate Valuation Adjustments: Automatic recalculations to assess the effects of changes on OFILM’s fair value.
- Flexible Excel Template: Designed for quick modifications, scenario analysis, and in-depth projections.
- Efficient and Precise: Bypass building models from the ground up while ensuring accuracy and adaptability.
Key Features
- Comprehensive OFILM Data: Pre-loaded with OFILM Group's historical performance metrics and future forecasts.
- Fully Adjustable Parameters: Modify revenue growth rates, profit margins, WACC, tax assumptions, and capital expenditures.
- Responsive Valuation Framework: Instantaneous recalculation of Net Present Value (NPV) and intrinsic value based on user adjustments.
- Scenario Analysis: Develop various forecasting scenarios to evaluate diverse valuation possibilities.
- Intuitive User Interface: Clean, organized design suitable for both seasoned professionals and newcomers.
How It Operates
- Download: Obtain the preformatted Excel file containing OFILM Group Co., Ltd.'s (002456SZ) financial data.
- Customize: Modify forecasts such as revenue growth, EBITDA percentage, and WACC.
- Update Automatically: Real-time updates for intrinsic value and NPV calculations.
- Test Scenarios: Generate various projections and instantly compare the results.
- Make Decisions: Utilize the valuation outcomes to inform your investment strategy.
Why Choose the OFILM Group Co., Ltd. (002456SZ) Calculator?
- All-in-One Tool: Incorporates DCF, WACC, and financial ratio analyses for comprehensive evaluations.
- Flexible Inputs: Modify the yellow-highlighted cells to explore different financial scenarios.
- In-Depth Analysis: Automatically calculates OFILM Group’s intrinsic value and Net Present Value.
- Preloaded Information: Access historical and projected data for a solid foundation.
- Expert-Level Quality: Perfect for financial analysts, investors, and business consultants alike.
Who Can Benefit from OFILM Group Co., Ltd. (002456SZ)?
- Investors: Make informed decisions using our comprehensive valuation resources.
- Financial Analysts: Enhance efficiency with our customizable financial models.
- Consultants: Easily tailor presentations and reports to meet client needs.
- Finance Enthusiasts: Expand your knowledge of valuation methods through practical examples.
- Educators and Students: Utilize our tools as effective learning aids in finance courses.
Contents of the Template
- Historical Data: Provides past financial performance and foundational forecasts for OFILM Group Co., Ltd. (002456SZ).
- DCF and Levered DCF Models: Comprehensive templates to determine OFILM Group's intrinsic value.
- WACC Sheet: Pre-configured calculations for the Weighted Average Cost of Capital.
- Editable Inputs: Adjust essential drivers such as growth rates, EBITDA percentages, and CAPEX assumptions.
- Quarterly and Annual Statements: A thorough analysis of OFILM Group Co., Ltd.'s (002456SZ) financials.
- Interactive Dashboard: Dynamically visualize valuation outcomes and future projections.
Disclaimer
All information, articles, and product details provided on this website are for general informational and educational purposes only. We do not claim any ownership over, nor do we intend to infringe upon, any trademarks, copyrights, logos, brand names, or other intellectual property mentioned or depicted on this site. Such intellectual property remains the property of its respective owners, and any references here are made solely for identification or informational purposes, without implying any affiliation, endorsement, or partnership.
We make no representations or warranties, express or implied, regarding the accuracy, completeness, or suitability of any content or products presented. Nothing on this website should be construed as legal, tax, investment, financial, medical, or other professional advice. In addition, no part of this site—including articles or product references—constitutes a solicitation, recommendation, endorsement, advertisement, or offer to buy or sell any securities, franchises, or other financial instruments, particularly in jurisdictions where such activity would be unlawful.
All content is of a general nature and may not address the specific circumstances of any individual or entity. It is not a substitute for professional advice or services. Any actions you take based on the information provided here are strictly at your own risk. You accept full responsibility for any decisions or outcomes arising from your use of this website and agree to release us from any liability in connection with your use of, or reliance upon, the content or products found herein.