
|
شركة Luxshare Precision Industry Co. ، Ltd. (002475.SZ) تقييم DCF |
Fully Editable: Tailor To Your Needs In Excel Or Sheets
Professional Design: Trusted, Industry-Standard Templates
Investor-Approved Valuation Models
MAC/PC Compatible, Fully Unlocked
No Expertise Is Needed; Easy To Follow
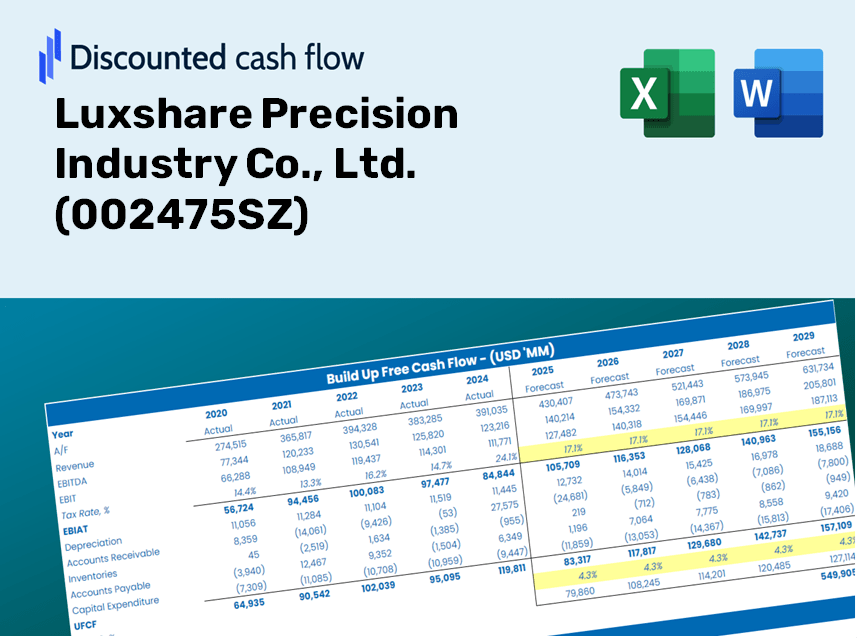
Luxshare Precision Industry Co., Ltd. (002475.SZ) Bundle
Discover the real worth of Luxshare Precision Industry Co., Ltd. (002475SZ) with our advanced DCF Calculator! Adjust critical assumptions, explore various scenarios, and evaluate how fluctuations affect Luxshare Precision's valuation – all within one convenient Excel template.
Benefits You'll Receive
- Flexible Forecast Inputs: Adjust key assumptions (growth %, profit margins, WACC) effortlessly to generate various scenarios.
- Industry-Specific Data: Luxshare Precision's financial data pre-loaded to facilitate your analysis.
- Automated DCF Calculations: The template computes Net Present Value (NPV) and intrinsic value automatically for your convenience.
- Professional and Adaptable: A sleek Excel model that customizes to meet your valuation requirements.
- Designed for Analysts and Investors: Perfect for assessing projections, validating strategies, and optimizing efficiency.
Key Features
- 🔍 Real-Life Luxshare Financials: Pre-filled historical and projected data for Luxshare Precision Industry Co., Ltd. (002475SZ).
- ✏️ Fully Customizable Inputs: Modify all essential parameters (yellow cells) such as WACC, growth %, and tax rates.
- 📊 Professional DCF Valuation: Built-in formulas determine Luxshare’s intrinsic value using the Discounted Cash Flow method.
- ⚡ Instant Results: Visualize Luxshare’s valuation immediately after making adjustments.
- Scenario Analysis: Evaluate and compare different financial assumptions side-by-side.
How It Operates
- Download the Template: Gain immediate access to the Excel-based Luxshare Precision DCF Calculator for (002475SZ).
- Input Your Assumptions: Edit the yellow-highlighted cells to modify growth rates, WACC, profit margins, and other key variables.
- Instant Calculations: The model automatically recalculates Luxshare Precision's intrinsic value.
- Test Scenarios: Experiment with different assumptions to assess potential changes in valuation.
- Analyze and Decide: Leverage the results to inform your investment choices or financial evaluations.
Who Can Benefit from This Product?
- Finance Students: Master valuation methods and practice them with real-world data.
- Academics: Integrate industry-standard models into your teaching or research.
- Investors: Validate your strategies and assess valuation scenarios for Luxshare Precision Industry Co., Ltd. (002475SZ).
- Analysts: Enhance your process with a ready-to-use, customizable DCF model.
- Small Business Owners: Discover how major public firms like Luxshare are evaluated.
Contents of the Template
- Operating and Balance Sheet Data: Pre-filled historical data and forecasts for Luxshare Precision Industry Co., Ltd. (002475SZ), covering revenue, EBITDA, EBIT, and capital expenditures.
- WACC Calculation: A dedicated sheet for the Weighted Average Cost of Capital (WACC), detailing parameters such as Beta, risk-free rate, and share price.
- DCF Valuation (Unlevered and Levered): Customizable Discounted Cash Flow models illustrating intrinsic value with comprehensive calculations.
- Financial Statements: Pre-loaded annual and quarterly financial statements to facilitate thorough analysis.
- Key Ratios: A collection of profitability, leverage, and efficiency ratios specifically for Luxshare Precision Industry Co., Ltd. (002475SZ).
- Dashboard and Charts: A visual overview of valuation results and assumptions, making it easy to interpret the findings.
Disclaimer
All information, articles, and product details provided on this website are for general informational and educational purposes only. We do not claim any ownership over, nor do we intend to infringe upon, any trademarks, copyrights, logos, brand names, or other intellectual property mentioned or depicted on this site. Such intellectual property remains the property of its respective owners, and any references here are made solely for identification or informational purposes, without implying any affiliation, endorsement, or partnership.
We make no representations or warranties, express or implied, regarding the accuracy, completeness, or suitability of any content or products presented. Nothing on this website should be construed as legal, tax, investment, financial, medical, or other professional advice. In addition, no part of this site—including articles or product references—constitutes a solicitation, recommendation, endorsement, advertisement, or offer to buy or sell any securities, franchises, or other financial instruments, particularly in jurisdictions where such activity would be unlawful.
All content is of a general nature and may not address the specific circumstances of any individual or entity. It is not a substitute for professional advice or services. Any actions you take based on the information provided here are strictly at your own risk. You accept full responsibility for any decisions or outcomes arising from your use of this website and agree to release us from any liability in connection with your use of, or reliance upon, the content or products found herein.