
|
شركة Jilin Liyuan Precision Manufacturing Co. ، Ltd. (002501.SZ) تقييم DCF |
Fully Editable: Tailor To Your Needs In Excel Or Sheets
Professional Design: Trusted, Industry-Standard Templates
Investor-Approved Valuation Models
MAC/PC Compatible, Fully Unlocked
No Expertise Is Needed; Easy To Follow
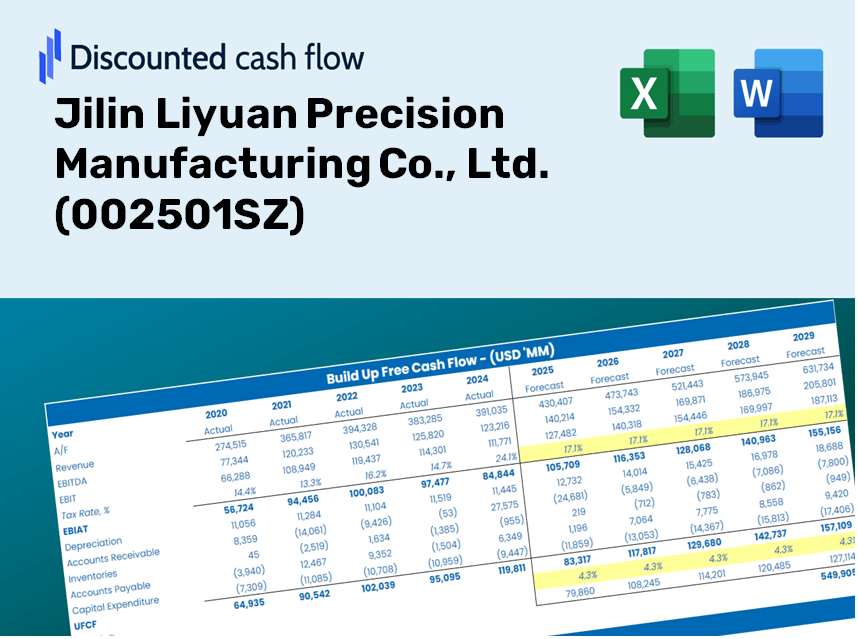
Jilin Liyuan Precision Manufacturing Co., Ltd. (002501.SZ) Bundle
Whether you're an investor or analyst, this (002501SZ) DCF Calculator is your go-to tool for accurate valuation. Loaded with real data from Jilin Liyuan Precision Manufacturing Co., Ltd., you can adjust forecasts and observe the effects in real time.
Discounted Cash Flow (DCF) - (USD MM)
| Year | AY1 2020 |
AY2 2021 |
AY3 2022 |
AY4 2023 |
AY5 2024 |
FY1 2025 |
FY2 2026 |
FY3 2027 |
FY4 2028 |
FY5 2029 |
|---|---|---|---|---|---|---|---|---|---|---|
| Revenue | 104.2 | 367.0 | 508.1 | 476.9 | 333.6 | 418.8 | 525.9 | 660.4 | 829.2 | 1,041.2 |
| Revenue Growth, % | 0 | 252.27 | 38.45 | -6.14 | -30.05 | 25.57 | 25.57 | 25.57 | 25.57 | 25.57 |
| EBITDA | -75.1 | -116.5 | -116.0 | -52.3 | -138.1 | -150.0 | -188.3 | -236.5 | -296.9 | -372.8 |
| EBITDA, % | -72.11 | -31.73 | -22.83 | -10.97 | -41.4 | -35.81 | -35.81 | -35.81 | -35.81 | -35.81 |
| Depreciation | 178.5 | 177.1 | 131.3 | 109.8 | 89.7 | 187.6 | 235.6 | 295.8 | 371.5 | 466.4 |
| Depreciation, % | 171.34 | 48.26 | 25.84 | 23.02 | 26.88 | 44.8 | 44.8 | 44.8 | 44.8 | 44.8 |
| EBIT | -253.6 | -293.6 | -247.3 | -162.1 | -227.7 | -277.2 | -348.1 | -437.1 | -548.8 | -689.1 |
| EBIT, % | -243.45 | -80 | -48.68 | -33.99 | -68.28 | -66.19 | -66.19 | -66.19 | -66.19 | -66.19 |
| Total Cash | 1,174.7 | 324.3 | 134.0 | 125.5 | 23.8 | 207.9 | 261.1 | 327.8 | 411.6 | 516.8 |
| Total Cash, percent | .0 | .0 | .0 | .0 | .0 | .0 | .0 | .0 | .0 | .0 |
| Account Receivables | 340.5 | 278.1 | 341.3 | 223.6 | 95.8 | 266.9 | 335.1 | 420.7 | 528.3 | 663.4 |
| Account Receivables, % | 326.88 | 75.78 | 67.17 | 46.89 | 28.71 | 63.71 | 63.71 | 63.71 | 63.71 | 63.71 |
| Inventories | 52.6 | 99.7 | 76.5 | 67.4 | 41.1 | 99.8 | 125.4 | 157.4 | 197.6 | 248.2 |
| Inventories, % | 50.48 | 27.18 | 15.05 | 14.14 | 12.33 | 23.84 | 23.84 | 23.84 | 23.84 | 23.84 |
| Accounts Payable | 79.5 | 19.8 | 19.5 | 21.6 | 20.6 | 80.6 | 101.2 | 127.0 | 159.5 | 200.3 |
| Accounts Payable, % | 76.28 | 5.39 | 3.84 | 4.52 | 6.17 | 19.24 | 19.24 | 19.24 | 19.24 | 19.24 |
| Capital Expenditure | -.1 | -67.6 | -15.2 | -13.5 | -7.8 | -22.3 | -28.0 | -35.2 | -44.2 | -55.5 |
| Capital Expenditure, % | -0.07117273 | -18.43 | -2.98 | -2.82 | -2.34 | -5.33 | -5.33 | -5.33 | -5.33 | -5.33 |
| Tax Rate, % | 0.17021 | 0.17021 | 0.17021 | 0.17021 | 0.17021 | 0.17021 | 0.17021 | 0.17021 | 0.17021 | 0.17021 |
| EBITAT | -253.6 | -293.6 | -247.3 | -162.1 | -227.4 | -277.1 | -348.0 | -436.9 | -548.6 | -688.9 |
| Depreciation | ||||||||||
| Changes in Account Receivables | ||||||||||
| Changes in Inventories | ||||||||||
| Changes in Accounts Payable | ||||||||||
| Capital Expenditure | ||||||||||
| UFCF | -388.8 | -228.5 | -171.4 | 63.0 | 7.6 | -281.6 | -213.5 | -268.1 | -336.7 | -422.7 |
| WACC, % | 7.79 | 7.79 | 7.79 | 7.79 | 7.79 | 7.79 | 7.79 | 7.79 | 7.79 | 7.79 |
| PV UFCF | ||||||||||
| SUM PV UFCF | -1,199.0 | |||||||||
| Long Term Growth Rate, % | 2.00 | |||||||||
| Free cash flow (T + 1) | -431 | |||||||||
| Terminal Value | -7,446 | |||||||||
| Present Terminal Value | -5,117 | |||||||||
| Enterprise Value | -6,316 | |||||||||
| Net Debt | 19 | |||||||||
| Equity Value | -6,335 | |||||||||
| Diluted Shares Outstanding, MM | 3,591 | |||||||||
| Equity Value Per Share | -1.76 |
What You Will Receive
- Authentic Jilin Liyuan Data: Comprehensive financials – encompassing revenue to EBIT – derived from real and forecasted data.
- Complete Customization: Modify all key parameters (highlighted cells) such as WACC, growth %, and tax rates to suit your analysis.
- Instant Valuation Adjustments: Automatic recalculations to assess the effects of changes on Jilin Liyuan's fair value.
- Flexible Excel Template: Designed for easy modifications, scenario analysis, and precise projections.
- Efficient and Precise: Avoid the hassle of constructing models from the ground up while ensuring accuracy and adaptability.
Key Features
- Real-Time Jilin Liyuan Data: Pre-loaded with Jilin Liyuan's historical performance metrics and future projections.
- Completely Customizable Inputs: Modify revenue growth rates, profit margins, discount rates, tax percentages, and capital investments.
- Interactive Valuation Model: Instant updates to Net Present Value (NPV) and intrinsic value based on user-defined parameters.
- Scenario Analysis: Develop various forecasting scenarios to evaluate different valuation results.
- Intuitive User Interface: Easy to navigate, well-structured, and suitable for both experts and newcomers.
How It Works
- Step 1: Download the Excel file.
- Step 2: Review pre-entered data for Jilin Liyuan Precision Manufacturing Co., Ltd. (002501SZ) including historical and projected figures.
- Step 3: Modify key assumptions (highlighted in yellow) according to your analysis.
- Step 4: Observe automatic recalculations of Jilin Liyuan's intrinsic value.
- Step 5: Utilize the results for making investment decisions or for reporting purposes.
Why Opt for Jilin Liyuan Precision Manufacturing Co., Ltd. (002501SZ)?
- Time-Efficient: No need to start from scratch—our solutions are ready for immediate use.
- Enhanced Accuracy: Dependable data and methodologies minimize errors in your analysis.
- Completely Customizable: Adjust the model to align with your specific assumptions and forecasts.
- User-Friendly: Intuitive charts and outputs allow for straightforward interpretation of results.
- Endorsed by Professionals: Crafted for experts who prioritize precision and functionality.
Who Can Benefit from This Product?
- Manufacturing Professionals: Create comprehensive and accurate cost models for production analysis.
- Corporate Strategy Teams: Evaluate production scenarios to inform strategic decisions.
- Consultants and Advisors: Offer clients precise insights on the valuation of Jilin Liyuan Precision Manufacturing Co., Ltd. (002501SZ).
- Academic Students and Instructors: Utilize real-world manufacturing data for financial modeling exercises and educational purposes.
- Industry Analysts: Gain insights into how companies like Jilin Liyuan are assessed in the manufacturing sector.
What the Template Includes
- Pre-Filled DCF Model: Jilin Liyuan Precision Manufacturing Co., Ltd.’s (002501SZ) financial data ready for immediate application.
- WACC Calculator: Comprehensive calculations for the Weighted Average Cost of Capital.
- Financial Ratios: Assess Jilin Liyuan’s profitability, leverage, and operational efficiency.
- Editable Inputs: Modify assumptions such as growth rates, profit margins, and capital expenditures to tailor your analysis.
- Financial Statements: Access annual and quarterly reports to facilitate in-depth analysis.
- Interactive Dashboard: Effortlessly visualize essential valuation metrics and findings.
Disclaimer
All information, articles, and product details provided on this website are for general informational and educational purposes only. We do not claim any ownership over, nor do we intend to infringe upon, any trademarks, copyrights, logos, brand names, or other intellectual property mentioned or depicted on this site. Such intellectual property remains the property of its respective owners, and any references here are made solely for identification or informational purposes, without implying any affiliation, endorsement, or partnership.
We make no representations or warranties, express or implied, regarding the accuracy, completeness, or suitability of any content or products presented. Nothing on this website should be construed as legal, tax, investment, financial, medical, or other professional advice. In addition, no part of this site—including articles or product references—constitutes a solicitation, recommendation, endorsement, advertisement, or offer to buy or sell any securities, franchises, or other financial instruments, particularly in jurisdictions where such activity would be unlawful.
All content is of a general nature and may not address the specific circumstances of any individual or entity. It is not a substitute for professional advice or services. Any actions you take based on the information provided here are strictly at your own risk. You accept full responsibility for any decisions or outcomes arising from your use of this website and agree to release us from any liability in connection with your use of, or reliance upon, the content or products found herein.