
|
شركة Hyunion Holding Co. ، Ltd (002537.SZ) تقييم DCF |
Fully Editable: Tailor To Your Needs In Excel Or Sheets
Professional Design: Trusted, Industry-Standard Templates
Investor-Approved Valuation Models
MAC/PC Compatible, Fully Unlocked
No Expertise Is Needed; Easy To Follow
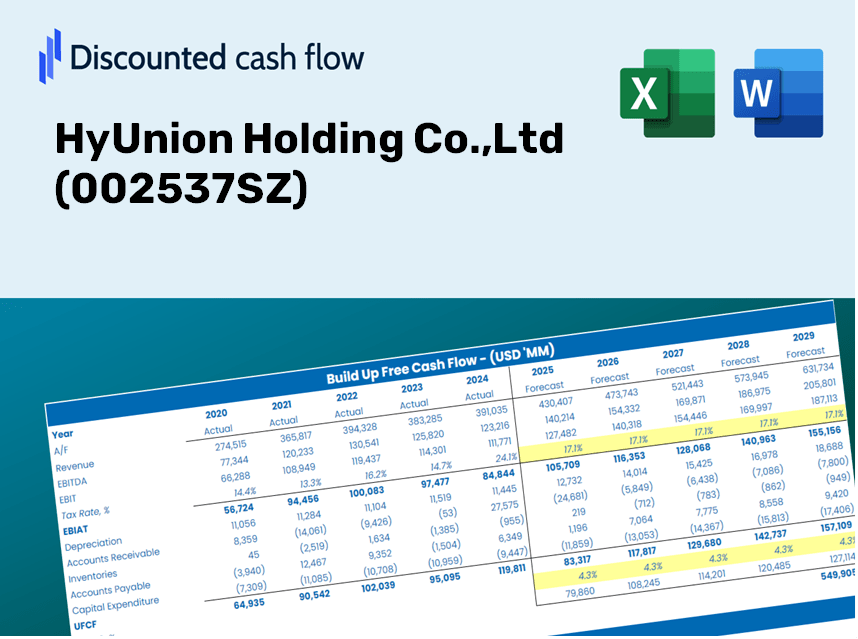
HyUnion Holding Co.,Ltd (002537.SZ) Bundle
Streamline your analysis and improve precision with our (002537SZ) DCF Calculator! Utilizing real data from HyUnion Holding Co., Ltd and customizable assumptions, this tool enables you to forecast, analyze, and value HyUnion like a seasoned investor.
Discounted Cash Flow (DCF) - (USD MM)
| Year | AY1 2020 |
AY2 2021 |
AY3 2022 |
AY4 2023 |
AY5 2024 |
FY1 2025 |
FY2 2026 |
FY3 2027 |
FY4 2028 |
FY5 2029 |
|---|---|---|---|---|---|---|---|---|---|---|
| Revenue | 6,324.0 | 7,249.9 | 7,844.4 | 8,495.3 | 7,487.9 | 7,848.8 | 8,227.2 | 8,623.7 | 9,039.4 | 9,475.1 |
| Revenue Growth, % | 0 | 14.64 | 8.2 | 8.3 | -11.86 | 4.82 | 4.82 | 4.82 | 4.82 | 4.82 |
| EBITDA | 493.6 | 615.4 | 430.9 | 373.5 | 355.1 | 485.4 | 508.8 | 533.4 | 559.1 | 586.0 |
| EBITDA, % | 7.8 | 8.49 | 5.49 | 4.4 | 4.74 | 6.18 | 6.18 | 6.18 | 6.18 | 6.18 |
| Depreciation | 219.0 | 239.5 | 267.0 | 275.5 | 278.1 | 268.8 | 281.8 | 295.4 | 309.6 | 324.5 |
| Depreciation, % | 3.46 | 3.3 | 3.4 | 3.24 | 3.71 | 3.43 | 3.43 | 3.43 | 3.43 | 3.43 |
| EBIT | 274.6 | 375.9 | 163.9 | 98.0 | 77.0 | 216.6 | 227.0 | 238.0 | 249.5 | 261.5 |
| EBIT, % | 4.34 | 5.18 | 2.09 | 1.15 | 1.03 | 2.76 | 2.76 | 2.76 | 2.76 | 2.76 |
| Total Cash | 1,563.4 | 1,724.7 | 1,882.5 | 1,984.2 | 1,158.1 | 1,747.7 | 1,831.9 | 1,920.2 | 2,012.8 | 2,109.8 |
| Total Cash, percent | .0 | .0 | .0 | .0 | .0 | .0 | .0 | .0 | .0 | .0 |
| Account Receivables | 1,472.8 | 1,629.4 | 1,638.1 | 1,819.4 | 1,894.8 | 1,779.6 | 1,865.4 | 1,955.3 | 2,049.5 | 2,148.3 |
| Account Receivables, % | 23.29 | 22.48 | 20.88 | 21.42 | 25.3 | 22.67 | 22.67 | 22.67 | 22.67 | 22.67 |
| Inventories | 719.9 | 1,171.5 | 1,037.9 | 925.1 | 921.1 | 1,004.1 | 1,052.5 | 1,103.2 | 1,156.4 | 1,212.2 |
| Inventories, % | 11.38 | 16.16 | 13.23 | 10.89 | 12.3 | 12.79 | 12.79 | 12.79 | 12.79 | 12.79 |
| Accounts Payable | 1,558.1 | 2,057.8 | 1,757.0 | 2,098.8 | 1,581.0 | 1,903.2 | 1,994.9 | 2,091.1 | 2,191.9 | 2,297.5 |
| Accounts Payable, % | 24.64 | 28.38 | 22.4 | 24.71 | 21.11 | 24.25 | 24.25 | 24.25 | 24.25 | 24.25 |
| Capital Expenditure | -151.6 | -160.0 | -200.3 | -174.9 | -138.1 | -173.6 | -182.0 | -190.8 | -200.0 | -209.6 |
| Capital Expenditure, % | -2.4 | -2.21 | -2.55 | -2.06 | -1.84 | -2.21 | -2.21 | -2.21 | -2.21 | -2.21 |
| Tax Rate, % | -57.46 | -57.46 | -57.46 | -57.46 | -57.46 | -57.46 | -57.46 | -57.46 | -57.46 | -57.46 |
| EBITAT | 231.0 | 289.1 | 117.4 | 95.6 | 121.3 | 186.4 | 195.4 | 204.8 | 214.7 | 225.0 |
| Depreciation | ||||||||||
| Changes in Account Receivables | ||||||||||
| Changes in Inventories | ||||||||||
| Changes in Accounts Payable | ||||||||||
| Capital Expenditure | ||||||||||
| UFCF | -336.1 | 260.0 | 8.1 | 469.6 | -327.9 | 636.0 | 252.8 | 264.9 | 277.7 | 291.1 |
| WACC, % | 7.31 | 7.28 | 7.27 | 7.35 | 7.36 | 7.31 | 7.31 | 7.31 | 7.31 | 7.31 |
| PV UFCF | ||||||||||
| SUM PV UFCF | 1,440.5 | |||||||||
| Long Term Growth Rate, % | 2.00 | |||||||||
| Free cash flow (T + 1) | 297 | |||||||||
| Terminal Value | 5,590 | |||||||||
| Present Terminal Value | 3,928 | |||||||||
| Enterprise Value | 5,368 | |||||||||
| Net Debt | 233 | |||||||||
| Equity Value | 5,135 | |||||||||
| Diluted Shares Outstanding, MM | 1,229 | |||||||||
| Equity Value Per Share | 4.18 |
Benefits You Will Receive
- Authentic (002537SZ) Financial Data: Pre-populated with HyUnion Holding Co., Ltd's historical and forecasted figures for accurate analysis.
- Completely Customizable Template: Easily adjust key metrics like revenue growth, WACC, and EBITDA percentage.
- Instant Calculations: Observe automatic updates to HyUnion's intrinsic value as you modify inputs.
- Expert Valuation Tool: Tailored for investors, analysts, and consultants seeking reliable DCF results.
- Intuitive Design: User-friendly layout and straightforward instructions suitable for all skill levels.
Key Features
- 🔍 Real-Life HyUnion Financials: Pre-filled historical and projected data for HyUnion Holding Co.,Ltd (002537SZ).
- ✏️ Fully Customizable Inputs: Adjust all critical parameters (yellow cells) such as WACC, growth %, and tax rates.
- 📊 Professional DCF Valuation: Built-in formulas calculate HyUnion’s intrinsic value using the Discounted Cash Flow method.
- ⚡ Instant Results: Visualize HyUnion’s valuation instantly after making changes.
- Scenario Analysis: Test and compare outcomes for various financial assumptions side-by-side.
How It Works
- Step 1: Download the prebuilt Excel template that includes HyUnion Holding Co., Ltd's (002537SZ) data.
- Step 2: Review the pre-filled sheets to familiarize yourself with the essential metrics.
- Step 3: Modify forecasts and assumptions in the editable yellow cells (WACC, growth, margins).
- Step 4: Instantly see the updated results, including HyUnion Holding Co., Ltd's (002537SZ) intrinsic value.
- Step 5: Utilize the outputs to make informed investment choices or create detailed reports.
Why Opt for This Calculator?
- Precision: Utilizes real HyUnion Holding Co., Ltd. (002537SZ) financial data for precise calculations.
- Versatility: Built for users to experiment and adjust parameters as needed.
- Efficiency: Avoid the complexities of developing a DCF model from the ground up.
- Expert-Level: Crafted with the accuracy and functionality expected at the CFO level.
- Intuitive: Simple to navigate, even for those lacking advanced financial modeling skills.
Who Should Utilize HyUnion Holding Co., Ltd's Services?
- Investors: Evaluate the valuation of HyUnion Holding Co., Ltd (002537SZ) before making investment decisions.
- CFOs and Financial Analysts: Optimize valuation workflows and validate financial forecasts.
- Startup Founders: Gain insights into the valuation methods used for established companies like HyUnion Holding Co., Ltd (002537SZ).
- Consultants: Provide detailed valuation analyses and reports for your clients.
- Students and Educators: Apply real-world case studies to enhance learning and teaching of valuation concepts.
Contents of the Template
- Historical Data: Provides past financial information and baseline forecasts for HyUnion Holding Co.,Ltd (002537SZ).
- DCF and Levered DCF Models: Comprehensive templates for calculating the intrinsic value of HyUnion Holding Co.,Ltd (002537SZ).
- WACC Sheet: Pre-configured calculations of the Weighted Average Cost of Capital.
- Editable Inputs: Customize essential factors such as growth rates, EBITDA percentages, and CAPEX estimates.
- Quarterly and Annual Statements: A thorough analysis of HyUnion Holding Co.,Ltd (002537SZ)’s financial performance.
- Interactive Dashboard: Dynamically visualize valuation outcomes and forecasts.
Disclaimer
All information, articles, and product details provided on this website are for general informational and educational purposes only. We do not claim any ownership over, nor do we intend to infringe upon, any trademarks, copyrights, logos, brand names, or other intellectual property mentioned or depicted on this site. Such intellectual property remains the property of its respective owners, and any references here are made solely for identification or informational purposes, without implying any affiliation, endorsement, or partnership.
We make no representations or warranties, express or implied, regarding the accuracy, completeness, or suitability of any content or products presented. Nothing on this website should be construed as legal, tax, investment, financial, medical, or other professional advice. In addition, no part of this site—including articles or product references—constitutes a solicitation, recommendation, endorsement, advertisement, or offer to buy or sell any securities, franchises, or other financial instruments, particularly in jurisdictions where such activity would be unlawful.
All content is of a general nature and may not address the specific circumstances of any individual or entity. It is not a substitute for professional advice or services. Any actions you take based on the information provided here are strictly at your own risk. You accept full responsibility for any decisions or outcomes arising from your use of this website and agree to release us from any liability in connection with your use of, or reliance upon, the content or products found herein.