
|
شركة Qingdao East Steel Tower Co.Ltd (002545.SZ) تقييم DCF |
Fully Editable: Tailor To Your Needs In Excel Or Sheets
Professional Design: Trusted, Industry-Standard Templates
Investor-Approved Valuation Models
MAC/PC Compatible, Fully Unlocked
No Expertise Is Needed; Easy To Follow
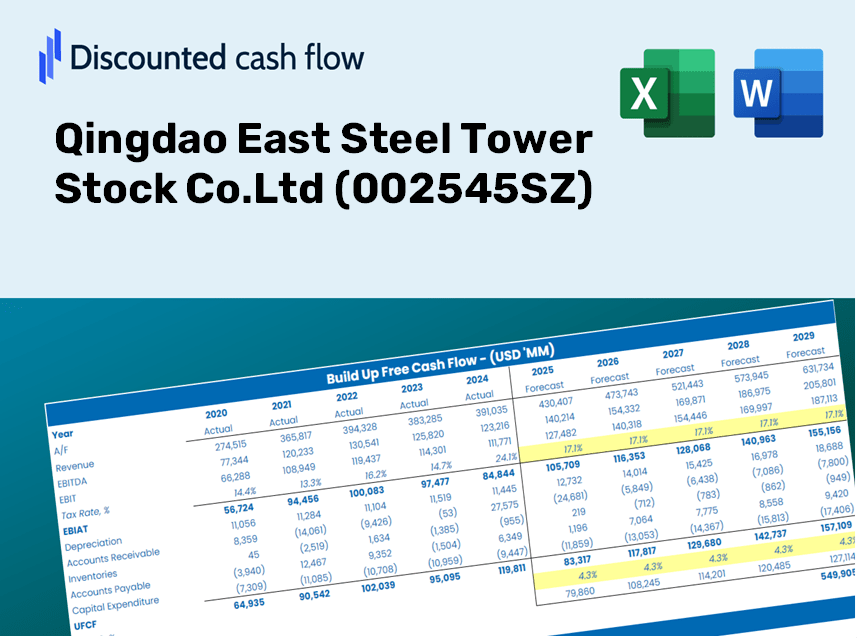
Qingdao East Steel Tower Stock Co.Ltd (002545.SZ) Bundle
Save time and improve precision with our (002545SZ) DCF Calculator! Equipped with real data from Qingdao East Steel Tower Stock Co., Ltd. and customizable assumptions, this tool empowers you to forecast, analyze, and evaluate (002545SZ) like a seasoned investor.
Discounted Cash Flow (DCF) - (USD MM)
| Year | AY1 2020 |
AY2 2021 |
AY3 2022 |
AY4 2023 |
AY5 2024 |
FY1 2025 |
FY2 2026 |
FY3 2027 |
FY4 2028 |
FY5 2029 |
|---|---|---|---|---|---|---|---|---|---|---|
| Revenue | 2,651.4 | 2,781.8 | 3,616.1 | 4,004.4 | 4,196.2 | 4,725.3 | 5,321.1 | 5,992.0 | 6,747.6 | 7,598.4 |
| Revenue Growth, % | 0 | 4.92 | 29.99 | 10.74 | 4.79 | 12.61 | 12.61 | 12.61 | 12.61 | 12.61 |
| EBITDA | 554.2 | 711.6 | 1,296.1 | 1,143.9 | 1,039.3 | 1,282.0 | 1,443.7 | 1,625.7 | 1,830.7 | 2,061.6 |
| EBITDA, % | 20.9 | 25.58 | 35.84 | 28.57 | 24.77 | 27.13 | 27.13 | 27.13 | 27.13 | 27.13 |
| Depreciation | 263.5 | 235.4 | 262.0 | 366.8 | 439.8 | 428.0 | 482.0 | 542.7 | 611.2 | 688.3 |
| Depreciation, % | 9.94 | 8.46 | 7.24 | 9.16 | 10.48 | 9.06 | 9.06 | 9.06 | 9.06 | 9.06 |
| EBIT | 290.6 | 476.2 | 1,034.1 | 777.1 | 599.5 | 854.0 | 961.7 | 1,083.0 | 1,219.5 | 1,373.3 |
| EBIT, % | 10.96 | 17.12 | 28.6 | 19.41 | 14.29 | 18.07 | 18.07 | 18.07 | 18.07 | 18.07 |
| Total Cash | 2,116.2 | 2,025.4 | 2,742.3 | 2,771.0 | 3,673.2 | 3,640.3 | 4,099.4 | 4,616.3 | 5,198.3 | 5,853.8 |
| Total Cash, percent | .0 | .0 | .0 | .0 | .0 | .0 | .0 | .0 | .0 | .0 |
| Account Receivables | 772.3 | 805.1 | 924.6 | 878.5 | 922.0 | 1,205.4 | 1,357.4 | 1,528.6 | 1,721.3 | 1,938.4 |
| Account Receivables, % | 29.13 | 28.94 | 25.57 | 21.94 | 21.97 | 25.51 | 25.51 | 25.51 | 25.51 | 25.51 |
| Inventories | 750.4 | 1,167.6 | 1,068.4 | 752.8 | 633.9 | 1,263.8 | 1,423.1 | 1,602.6 | 1,804.6 | 2,032.2 |
| Inventories, % | 28.3 | 41.97 | 29.54 | 18.8 | 15.11 | 26.74 | 26.74 | 26.74 | 26.74 | 26.74 |
| Accounts Payable | 319.0 | 424.6 | 564.8 | 816.9 | 745.5 | 766.3 | 862.9 | 971.7 | 1,094.2 | 1,232.2 |
| Accounts Payable, % | 12.03 | 15.26 | 15.62 | 20.4 | 17.77 | 16.22 | 16.22 | 16.22 | 16.22 | 16.22 |
| Capital Expenditure | -145.6 | -176.0 | -228.6 | -181.1 | -413.5 | -307.3 | -346.0 | -389.7 | -438.8 | -494.1 |
| Capital Expenditure, % | -5.49 | -6.33 | -6.32 | -4.52 | -9.85 | -6.5 | -6.5 | -6.5 | -6.5 | -6.5 |
| Tax Rate, % | 17.64 | 17.64 | 17.64 | 17.64 | 17.64 | 17.64 | 17.64 | 17.64 | 17.64 | 17.64 |
| EBITAT | 250.5 | 385.0 | 792.4 | 608.8 | 493.7 | 690.7 | 777.7 | 875.8 | 986.2 | 1,110.6 |
| Depreciation | ||||||||||
| Changes in Account Receivables | ||||||||||
| Changes in Inventories | ||||||||||
| Changes in Accounts Payable | ||||||||||
| Capital Expenditure | ||||||||||
| UFCF | -835.3 | 100.1 | 945.6 | 1,408.4 | 524.0 | -81.1 | 699.0 | 787.1 | 886.3 | 998.1 |
| WACC, % | 7.02 | 7 | 6.98 | 6.99 | 7.01 | 7 | 7 | 7 | 7 | 7 |
| PV UFCF | ||||||||||
| SUM PV UFCF | 2,565.0 | |||||||||
| Long Term Growth Rate, % | 1.00 | |||||||||
| Free cash flow (T + 1) | 1,008 | |||||||||
| Terminal Value | 16,802 | |||||||||
| Present Terminal Value | 11,980 | |||||||||
| Enterprise Value | 14,545 | |||||||||
| Net Debt | -1,683 | |||||||||
| Equity Value | 16,228 | |||||||||
| Diluted Shares Outstanding, MM | 1,244 | |||||||||
| Equity Value Per Share | 13.04 |
What You Will Receive
- Adjustable Forecast Inputs: Effortlessly modify key assumptions (growth %, margins, WACC) to generate various scenarios for analysis.
- Relevant Financial Data: Pre-loaded financial information for Qingdao East Steel Tower Stock Co. Ltd (002545SZ) to kickstart your evaluation.
- Automated DCF Calculations: The model computes Net Present Value (NPV) and intrinsic value automatically.
- Professional and Customizable: An expertly designed Excel template that can be tailored to fit your valuation requirements.
- Designed for Analysts and Investors: Perfect for testing forecasts, verifying strategies, and enhancing efficiency.
Key Features
- Genuine Financial Data: Gain access to precise historical figures and future forecasts for Qingdao East Steel Tower Stock Co. Ltd (002545SZ).
- Personalized Forecast Parameters: Modify highlighted cells for WACC, growth rates, and profit margins.
- Real-Time Calculations: Automatic updates for DCF, Net Present Value (NPV), and cash flow assessments.
- Interactive Dashboard: User-friendly charts and summaries that make interpreting your valuation insights easy.
- Suitable for All Users: Designed with a straightforward interface for investors, CFOs, and consultants alike.
How It Works
- Download: Obtain the pre-configured Excel file featuring Qingdao East Steel Tower Stock Co. Ltd's (002545SZ) financial data.
- Customize: Modify key metrics such as revenue growth, EBITDA percentage, and WACC according to your analysis needs.
- Update Automatically: Watch as intrinsic value and NPV calculations refresh in real-time with your input.
- Test Scenarios: Generate various forecasts and instantly analyze different outcomes.
- Make Decisions: Utilize the valuation findings to inform your investment approach.
Why Choose This Calculator for Qingdao East Steel Tower Stock Co. Ltd (002545SZ)?
- Designed for Experts: A sophisticated tool tailored for analysts, CFOs, and industry consultants.
- Up-to-Date Data: Access to Qingdao East Steel Tower's historical and projected financials for enhanced accuracy.
- Forecast Simulation: Easily test various scenarios and assumptions to refine your analysis.
- Concise Outputs: Automatically computes intrinsic value, NPV, and other essential metrics.
- User-Friendly: Step-by-step guidance ensures a smooth experience throughout the calculation process.
Who Can Benefit from Qingdao East Steel Tower (002545SZ)?
- Investors: Enhance your investment strategies with insights from a reliable valuation tool.
- Financial Analysts: Streamline your workflow using a customizable DCF model designed for efficiency.
- Consultants: Effortlessly tailor the template for impactful client presentations or detailed reports.
- Finance Enthusiasts: Broaden your knowledge of valuation methods through practical, real-world case studies.
- Educators and Students: Utilize this resource as a valuable aid in finance-related curricula.
Contents of the Template
- Operating and Balance Sheet Data: Pre-filled historical data and forecasts for Qingdao East Steel Tower Stock Co. Ltd (002545SZ), including revenue, EBITDA, EBIT, and capital expenditures.
- WACC Calculation: A dedicated sheet for calculating the Weighted Average Cost of Capital (WACC), featuring key parameters such as Beta, risk-free rate, and share price.
- DCF Valuation (Unlevered and Levered): Customizable Discounted Cash Flow models that illustrate intrinsic value with comprehensive calculations.
- Financial Statements: Pre-loaded financial statements (annual and quarterly) to facilitate thorough analysis.
- Key Ratios: Includes critical profitability, leverage, and efficiency ratios for Qingdao East Steel Tower Stock Co. Ltd (002545SZ).
- Dashboard and Charts: A visual summary of valuation outputs and assumptions for easy analysis of results.
Disclaimer
All information, articles, and product details provided on this website are for general informational and educational purposes only. We do not claim any ownership over, nor do we intend to infringe upon, any trademarks, copyrights, logos, brand names, or other intellectual property mentioned or depicted on this site. Such intellectual property remains the property of its respective owners, and any references here are made solely for identification or informational purposes, without implying any affiliation, endorsement, or partnership.
We make no representations or warranties, express or implied, regarding the accuracy, completeness, or suitability of any content or products presented. Nothing on this website should be construed as legal, tax, investment, financial, medical, or other professional advice. In addition, no part of this site—including articles or product references—constitutes a solicitation, recommendation, endorsement, advertisement, or offer to buy or sell any securities, franchises, or other financial instruments, particularly in jurisdictions where such activity would be unlawful.
All content is of a general nature and may not address the specific circumstances of any individual or entity. It is not a substitute for professional advice or services. Any actions you take based on the information provided here are strictly at your own risk. You accept full responsibility for any decisions or outcomes arising from your use of this website and agree to release us from any liability in connection with your use of, or reliance upon, the content or products found herein.