
|
شركة فوجيان سنمان ، المحدودة (002639.SZ) تقييم DCF |
Fully Editable: Tailor To Your Needs In Excel Or Sheets
Professional Design: Trusted, Industry-Standard Templates
Investor-Approved Valuation Models
MAC/PC Compatible, Fully Unlocked
No Expertise Is Needed; Easy To Follow
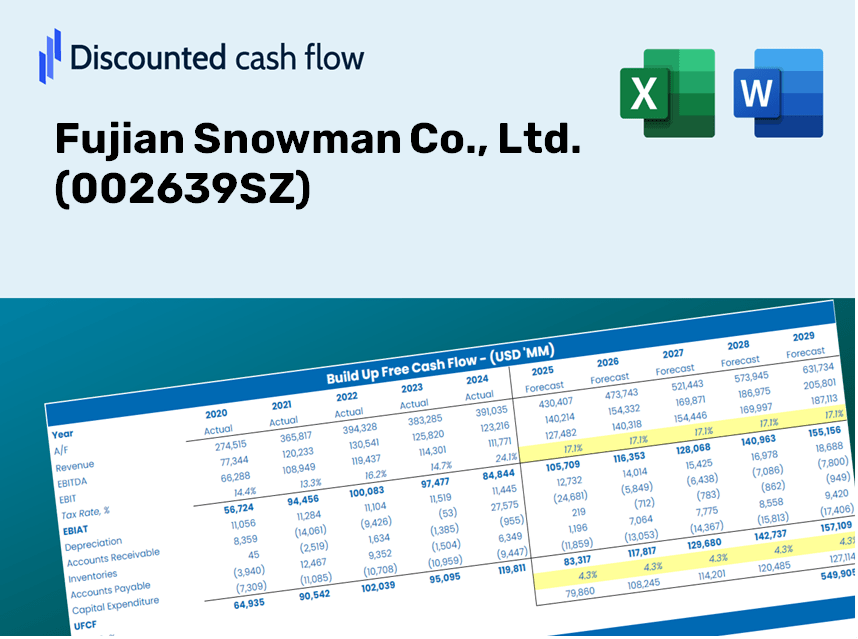
Fujian Snowman Co., Ltd. (002639.SZ) Bundle
For both investors and analysts, this [Symbol] DCF Calculator is an essential resource for accurate valuation. Loaded with real data from Fujian Snowman Co., Ltd., you can adjust forecasts and observe the effects in real time.
Discounted Cash Flow (DCF) - (USD MM)
| Year | AY1 2020 |
AY2 2021 |
AY3 2022 |
AY4 2023 |
AY5 2024 |
FY1 2025 |
FY2 2026 |
FY3 2027 |
FY4 2028 |
FY5 2029 |
|---|---|---|---|---|---|---|---|---|---|---|
| Revenue | 1,458.4 | 2,008.7 | 1,966.0 | 2,032.5 | 2,284.8 | 2,578.4 | 2,909.7 | 3,283.6 | 3,705.6 | 4,181.8 |
| Revenue Growth, % | 0 | 37.73 | -2.12 | 3.38 | 12.41 | 12.85 | 12.85 | 12.85 | 12.85 | 12.85 |
| EBITDA | -9.8 | -1.3 | -59.7 | 118.3 | 218.2 | 59.8 | 67.5 | 76.1 | 85.9 | 97.0 |
| EBITDA, % | -0.66963 | -0.06552517 | -3.04 | 5.82 | 9.55 | 2.32 | 2.32 | 2.32 | 2.32 | 2.32 |
| Depreciation | 103.2 | 102.8 | 110.4 | 113.8 | 114.0 | 146.5 | 165.3 | 186.5 | 210.5 | 237.6 |
| Depreciation, % | 7.08 | 5.12 | 5.62 | 5.6 | 4.99 | 5.68 | 5.68 | 5.68 | 5.68 | 5.68 |
| EBIT | -113.0 | -104.2 | -170.1 | 4.4 | 104.1 | -86.7 | -97.8 | -110.4 | -124.6 | -140.6 |
| EBIT, % | -7.75 | -5.19 | -8.65 | 0.21699 | 4.56 | -3.36 | -3.36 | -3.36 | -3.36 | -3.36 |
| Total Cash | 306.0 | 736.8 | 514.4 | 583.8 | 578.1 | 710.9 | 802.2 | 905.3 | 1,021.7 | 1,153.0 |
| Total Cash, percent | .0 | .0 | .0 | .0 | .0 | .0 | .0 | .0 | .0 | .0 |
| Account Receivables | 825.3 | 986.4 | 1,145.3 | 1,093.6 | 1,025.3 | 1,354.4 | 1,528.4 | 1,724.8 | 1,946.5 | 2,196.6 |
| Account Receivables, % | 56.59 | 49.11 | 58.26 | 53.81 | 44.87 | 52.53 | 52.53 | 52.53 | 52.53 | 52.53 |
| Inventories | 676.7 | 740.1 | 763.7 | 756.5 | 767.2 | 994.7 | 1,122.5 | 1,266.8 | 1,429.6 | 1,613.3 |
| Inventories, % | 46.4 | 36.85 | 38.85 | 37.22 | 33.58 | 38.58 | 38.58 | 38.58 | 38.58 | 38.58 |
| Accounts Payable | 461.0 | 496.9 | 497.2 | 415.5 | 399.9 | 616.6 | 695.9 | 785.3 | 886.2 | 1,000.1 |
| Accounts Payable, % | 31.61 | 24.74 | 25.29 | 20.44 | 17.5 | 23.92 | 23.92 | 23.92 | 23.92 | 23.92 |
| Capital Expenditure | -74.1 | -44.0 | -70.1 | -215.8 | -89.0 | -130.7 | -147.5 | -166.5 | -187.9 | -212.0 |
| Capital Expenditure, % | -5.08 | -2.19 | -3.56 | -10.62 | -3.89 | -5.07 | -5.07 | -5.07 | -5.07 | -5.07 |
| Tax Rate, % | 34.6 | 34.6 | 34.6 | 34.6 | 34.6 | 34.6 | 34.6 | 34.6 | 34.6 | 34.6 |
| EBITAT | -98.6 | -76.8 | -160.8 | 1.8 | 68.1 | -62.9 | -71.0 | -80.1 | -90.4 | -102.0 |
| Depreciation | ||||||||||
| Changes in Account Receivables | ||||||||||
| Changes in Inventories | ||||||||||
| Changes in Accounts Payable | ||||||||||
| Capital Expenditure | ||||||||||
| UFCF | -1,110.5 | -206.8 | -302.6 | -122.8 | 135.2 | -386.9 | -275.8 | -311.2 | -351.2 | -396.4 |
| WACC, % | 7.36 | 7.29 | 7.4 | 7.13 | 7.25 | 7.29 | 7.29 | 7.29 | 7.29 | 7.29 |
| PV UFCF | ||||||||||
| SUM PV UFCF | -1,396.2 | |||||||||
| Long Term Growth Rate, % | 2.00 | |||||||||
| Free cash flow (T + 1) | -404 | |||||||||
| Terminal Value | -7,647 | |||||||||
| Present Terminal Value | -5,379 | |||||||||
| Enterprise Value | -6,776 | |||||||||
| Net Debt | 424 | |||||||||
| Equity Value | -7,200 | |||||||||
| Diluted Shares Outstanding, MM | 772 | |||||||||
| Equity Value Per Share | -9.32 |
What You Will Receive
- Authentic Fujian Snowman Data: Comprehensive financials – from revenue to EBIT – based on real and forecasted figures.
- Complete Customization: Adjust all key parameters (yellow cells) such as WACC, growth %, and tax rates to fit your analysis.
- Immediate Valuation Updates: Automatic recalculations to evaluate how changes impact the fair value of Fujian Snowman Co., Ltd. (002639SZ).
- Flexible Excel Template: Designed for quick modifications, scenario analysis, and detailed forecasts.
- Efficient and Accurate: Save time by avoiding model creation from scratch while ensuring accuracy and adaptability.
Key Features
- Comprehensive DCF Calculator: Offers detailed unlevered and levered DCF valuation models tailored for Fujian Snowman Co., Ltd. (002639SZ).
- WACC Estimator: Features a pre-designed Weighted Average Cost of Capital sheet with options for customizable inputs.
- Adjustable Forecast Parameters: Allows users to modify growth rates, capital expenditures, and discount rates as needed.
- Integrated Financial Ratios: Evaluate profitability, leverage, and efficiency ratios specifically for Fujian Snowman Co., Ltd. (002639SZ).
- Interactive Dashboard and Charts: Visual representations provide a summary of essential valuation metrics for straightforward analysis.
How It Operates
- Step 1: Download the Excel template.
- Step 2: Examine the pre-filled financial data and projections for Fujian Snowman Co., Ltd. (002639SZ).
- Step 3: Adjust key inputs such as revenue growth, WACC, and tax rates (highlighted cells).
- Step 4: Observe the DCF model refresh in real-time as you modify your assumptions.
- Step 5: Evaluate the outputs and leverage the findings for your investment choices.
Why Choose This Calculator for Fujian Snowman Co., Ltd. (002639SZ)?
- Designed for Experts: A sophisticated tool utilized by analysts, CFOs, and consultants.
- Accurate Financial Data: Fujian Snowman’s historical and projected financials are preloaded for precise analysis.
- Forecast Simulation: Effortlessly test various scenarios and assumptions.
- Clear Results: Instantly calculates intrinsic value, NPV, and essential metrics.
- User-Friendly: Detailed step-by-step instructions walk you through the entire process.
Who Can Benefit from This Product?
- Institutional Investors: Develop comprehensive and accurate valuation models for analyzing portfolios related to Fujian Snowman Co., Ltd. (002639SZ).
- Corporate Finance Departments: Evaluate valuation scenarios to inform organizational strategies for growth.
- Financial Consultants: Deliver precise valuation insights to clients focused on investing in Fujian Snowman Co., Ltd. (002639SZ).
- Academics and Students: Utilize current data for practical applications in financial modeling education.
- Industry Analysts: Gain insights into the valuation processes of companies like Fujian Snowman Co., Ltd. (002639SZ).
Contents of the Template
- Detailed DCF Model: An editable template featuring thorough valuation calculations.
- Historical Data: Fujian Snowman Co., Ltd.’s (002639SZ) past and expected financials included for analysis.
- Flexible Parameters: Modify WACC, growth rates, and tax assumptions to explore different scenarios.
- Financial Statements: Comprehensive annual and quarterly reports for enhanced insights.
- Essential Ratios: Integrated analysis for assessing profitability, efficiency, and leverage.
- Dashboard with Visual Analytics: Charts and tables designed for clear, actionable results.
Disclaimer
All information, articles, and product details provided on this website are for general informational and educational purposes only. We do not claim any ownership over, nor do we intend to infringe upon, any trademarks, copyrights, logos, brand names, or other intellectual property mentioned or depicted on this site. Such intellectual property remains the property of its respective owners, and any references here are made solely for identification or informational purposes, without implying any affiliation, endorsement, or partnership.
We make no representations or warranties, express or implied, regarding the accuracy, completeness, or suitability of any content or products presented. Nothing on this website should be construed as legal, tax, investment, financial, medical, or other professional advice. In addition, no part of this site—including articles or product references—constitutes a solicitation, recommendation, endorsement, advertisement, or offer to buy or sell any securities, franchises, or other financial instruments, particularly in jurisdictions where such activity would be unlawful.
All content is of a general nature and may not address the specific circumstances of any individual or entity. It is not a substitute for professional advice or services. Any actions you take based on the information provided here are strictly at your own risk. You accept full responsibility for any decisions or outcomes arising from your use of this website and agree to release us from any liability in connection with your use of, or reliance upon, the content or products found herein.