
|
شركة Era Co.، Ltd. (002641.SZ) تقييم DCF |
Fully Editable: Tailor To Your Needs In Excel Or Sheets
Professional Design: Trusted, Industry-Standard Templates
Investor-Approved Valuation Models
MAC/PC Compatible, Fully Unlocked
No Expertise Is Needed; Easy To Follow
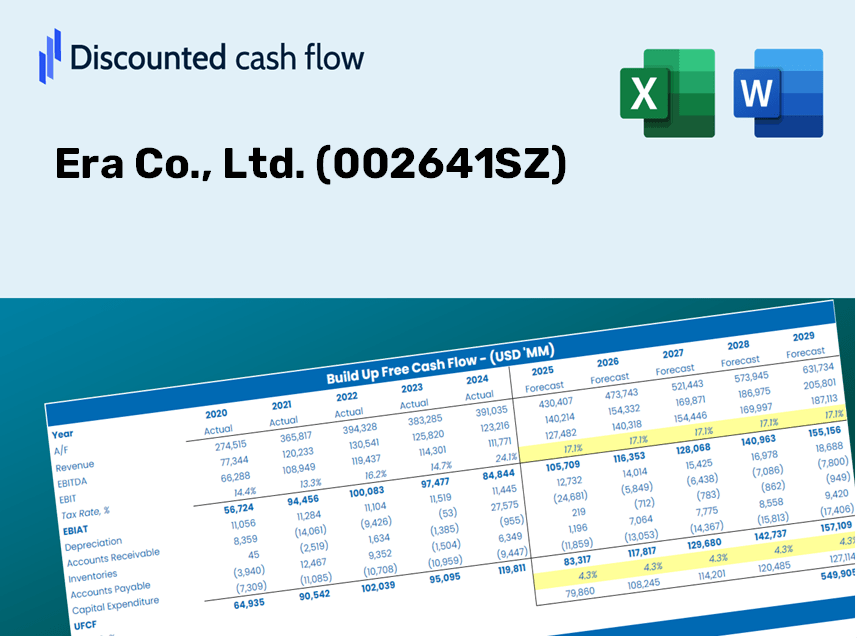
Era Co., Ltd. (002641.SZ) Bundle
Designed for accuracy, our (002641SZ) DCF Calculator enables you to evaluate Era Co., Ltd. valuation using genuine financial data, while offering complete flexibility to modify all key parameters for enhanced projections.
Discounted Cash Flow (DCF) - (USD MM)
| Year | AY1 2020 |
AY2 2021 |
AY3 2022 |
AY4 2023 |
AY5 2024 |
FY1 2025 |
FY2 2026 |
FY3 2027 |
FY4 2028 |
FY5 2029 |
|---|---|---|---|---|---|---|---|---|---|---|
| Revenue | 7,036.3 | 8,881.0 | 7,978.5 | 7,471.3 | 6,602.0 | 7,067.9 | 7,566.6 | 8,100.6 | 8,672.2 | 9,284.2 |
| Revenue Growth, % | 0 | 26.22 | -10.16 | -6.36 | -11.64 | 7.06 | 7.06 | 7.06 | 7.06 | 7.06 |
| EBITDA | 1,120.4 | 892.6 | 371.6 | 752.7 | 555.6 | 694.4 | 743.4 | 795.8 | 852.0 | 912.1 |
| EBITDA, % | 15.92 | 10.05 | 4.66 | 10.07 | 8.42 | 9.82 | 9.82 | 9.82 | 9.82 | 9.82 |
| Depreciation | 227.0 | 253.8 | 292.6 | 328.0 | 341.8 | 273.1 | 292.4 | 313.0 | 335.1 | 358.7 |
| Depreciation, % | 3.23 | 2.86 | 3.67 | 4.39 | 5.18 | 3.86 | 3.86 | 3.86 | 3.86 | 3.86 |
| EBIT | 893.4 | 638.8 | 79.1 | 424.7 | 213.7 | 421.3 | 451.0 | 482.8 | 516.9 | 553.4 |
| EBIT, % | 12.7 | 7.19 | 0.99107 | 5.68 | 3.24 | 5.96 | 5.96 | 5.96 | 5.96 | 5.96 |
| Total Cash | 2,054.4 | 1,551.0 | 1,390.8 | 1,914.8 | 1,189.4 | 1,523.0 | 1,630.4 | 1,745.5 | 1,868.7 | 2,000.5 |
| Total Cash, percent | .0 | .0 | .0 | .0 | .0 | .0 | .0 | .0 | .0 | .0 |
| Account Receivables | 1,402.7 | 1,616.7 | 1,227.0 | 1,116.2 | 1,192.4 | 1,223.0 | 1,309.3 | 1,401.7 | 1,500.6 | 1,606.5 |
| Account Receivables, % | 19.94 | 18.2 | 15.38 | 14.94 | 18.06 | 17.3 | 17.3 | 17.3 | 17.3 | 17.3 |
| Inventories | 1,177.0 | 1,570.2 | 1,374.0 | 1,176.9 | 1,166.1 | 1,202.2 | 1,287.0 | 1,377.8 | 1,475.0 | 1,579.1 |
| Inventories, % | 16.73 | 17.68 | 17.22 | 15.75 | 17.66 | 17.01 | 17.01 | 17.01 | 17.01 | 17.01 |
| Accounts Payable | 1,698.9 | 2,306.3 | 2,239.1 | 1,584.0 | 1,653.0 | 1,758.7 | 1,882.8 | 2,015.7 | 2,157.9 | 2,310.2 |
| Accounts Payable, % | 24.14 | 25.97 | 28.06 | 21.2 | 25.04 | 24.88 | 24.88 | 24.88 | 24.88 | 24.88 |
| Capital Expenditure | -508.9 | -699.6 | -605.3 | -356.3 | -326.5 | -458.2 | -490.5 | -525.1 | -562.2 | -601.8 |
| Capital Expenditure, % | -7.23 | -7.88 | -7.59 | -4.77 | -4.95 | -6.48 | -6.48 | -6.48 | -6.48 | -6.48 |
| Tax Rate, % | 9.89 | 9.89 | 9.89 | 9.89 | 9.89 | 9.89 | 9.89 | 9.89 | 9.89 | 9.89 |
| EBITAT | 779.9 | 574.8 | 88.8 | 372.9 | 192.6 | 383.5 | 410.6 | 439.6 | 470.6 | 503.8 |
| Depreciation | ||||||||||
| Changes in Account Receivables | ||||||||||
| Changes in Inventories | ||||||||||
| Changes in Accounts Payable | ||||||||||
| Capital Expenditure | ||||||||||
| UFCF | -382.9 | 129.2 | 294.8 | -2.5 | 211.4 | 237.5 | 165.4 | 177.1 | 189.6 | 203.0 |
| WACC, % | 4.6 | 4.61 | 4.62 | 4.6 | 4.61 | 4.61 | 4.61 | 4.61 | 4.61 | 4.61 |
| PV UFCF | ||||||||||
| SUM PV UFCF | 853.3 | |||||||||
| Long Term Growth Rate, % | 3.50 | |||||||||
| Free cash flow (T + 1) | 210 | |||||||||
| Terminal Value | 18,955 | |||||||||
| Present Terminal Value | 15,132 | |||||||||
| Enterprise Value | 15,985 | |||||||||
| Net Debt | -918 | |||||||||
| Equity Value | 16,903 | |||||||||
| Diluted Shares Outstanding, MM | 1,217 | |||||||||
| Equity Value Per Share | 13.89 |
What You Will Gain
- Authentic Era Co. Data: Prepopulated financial metrics – encompassing revenue to EBIT – utilizing actual and forecasted figures.
- Comprehensive Customization: Modify all key variables (yellow cells) such as WACC, growth %, and tax rates.
- Immediate Valuation Adjustments: Automatic recalculations to assess how changes impact Era Co.'s fair value.
- Flexible Excel Template: Designed for quick modifications, scenario analyses, and thorough projections.
- Efficient and Precise: Avoid starting model construction from scratch while ensuring precision and adaptability.
Key Features
- Pre-Loaded Data: Era Co., Ltd.'s historical financial statements and pre-filled forecasts.
- Fully Adjustable Inputs: Customize WACC, tax rates, revenue growth, and EBITDA margins.
- Instant Results: View Era Co., Ltd.'s intrinsic value updating in real time.
- Clear Visual Outputs: Dashboard charts present valuation outcomes and essential metrics.
- Built for Accuracy: A professional-grade tool for analysts, investors, and finance professionals.
How It Functions
- Download: Obtain the pre-loaded Excel file featuring Era Co., Ltd.'s (002641SZ) financial information.
- Customize: Modify forecasts, such as revenue growth, EBITDA %, and WACC as needed.
- Update Automatically: Real-time updates for intrinsic value and NPV calculations.
- Test Scenarios: Generate various projections and immediately compare results.
- Make Decisions: Leverage the valuation outcomes to inform your investment choices.
Why Opt for Era Co., Ltd. (002641SZ) Calculator?
- All-in-One Solution: Offers DCF, WACC, and financial ratio analyses seamlessly integrated.
- Flexible Inputs: Modify yellow-highlighted cells to explore different financial scenarios.
- In-Depth Analysis: Automatically determines the intrinsic value and Net Present Value for Era Co., Ltd. (002641SZ).
- Data Ready: Comes with historical and projected data for precise calculations.
- High-Quality Standards: Perfectly suited for financial analysts, investors, and business consultants.
Who Would Benefit from This Product?
- Professional Investors: Develop comprehensive and trustworthy valuation models for portfolio evaluations.
- Corporate Finance Teams: Examine valuation scenarios to inform internal strategies.
- Consultants and Advisors: Deliver precise valuation insights for Era Co., Ltd. (002641SZ).
- Students and Educators: Utilize real-world data to practice and instruct in financial modeling.
- Tech Enthusiasts: Gain insights into how tech firms like Era Co., Ltd. are appraised in the market.
Contents of the Template
- Pre-Filled Data: Contains Era Co., Ltd.'s historical financial performance and projections.
- Discounted Cash Flow Model: An editable DCF valuation model featuring automatic calculations.
- Weighted Average Cost of Capital (WACC): A specific sheet designed for WACC calculation based on user-defined inputs.
- Key Financial Ratios: Evaluate Era Co., Ltd.'s profitability, efficiency, and financial leverage.
- Customizable Inputs: Easily modify revenue growth, profit margins, and tax rates.
- Clear Dashboard: Visual representations and tables summarizing essential valuation outcomes.
Disclaimer
All information, articles, and product details provided on this website are for general informational and educational purposes only. We do not claim any ownership over, nor do we intend to infringe upon, any trademarks, copyrights, logos, brand names, or other intellectual property mentioned or depicted on this site. Such intellectual property remains the property of its respective owners, and any references here are made solely for identification or informational purposes, without implying any affiliation, endorsement, or partnership.
We make no representations or warranties, express or implied, regarding the accuracy, completeness, or suitability of any content or products presented. Nothing on this website should be construed as legal, tax, investment, financial, medical, or other professional advice. In addition, no part of this site—including articles or product references—constitutes a solicitation, recommendation, endorsement, advertisement, or offer to buy or sell any securities, franchises, or other financial instruments, particularly in jurisdictions where such activity would be unlawful.
All content is of a general nature and may not address the specific circumstances of any individual or entity. It is not a substitute for professional advice or services. Any actions you take based on the information provided here are strictly at your own risk. You accept full responsibility for any decisions or outcomes arising from your use of this website and agree to release us from any liability in connection with your use of, or reliance upon, the content or products found herein.