
|
Ronglian Group Ltd. (002642.SZ) تقييم DCF |
Fully Editable: Tailor To Your Needs In Excel Or Sheets
Professional Design: Trusted, Industry-Standard Templates
Investor-Approved Valuation Models
MAC/PC Compatible, Fully Unlocked
No Expertise Is Needed; Easy To Follow
Ronglian Group Ltd. (002642.SZ) Bundle
Explore the financial outlook of Ronglian Group Ltd. (002642SZ) with our user-friendly DCF Calculator! Enter your projections for growth, profit margins, and expenses to determine the intrinsic value of Ronglian Group Ltd. (002642SZ) and refine your investment approach.
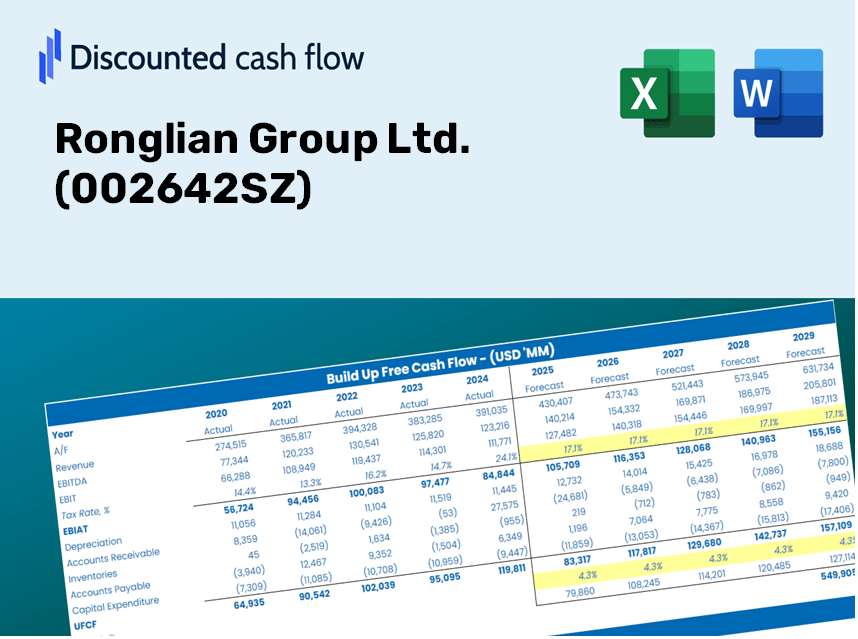
Discounted Cash Flow (DCF) - (USD MM)
| Year | AY1 2020 |
AY2 2021 |
AY3 2022 |
AY4 2023 |
AY5 2024 |
FY1 2025 |
FY2 2026 |
FY3 2027 |
FY4 2028 |
FY5 2029 |
|---|---|---|---|---|---|---|---|---|---|---|
| Revenue | 2,813.0 | 3,582.5 | 3,738.8 | 2,375.8 | 2,021.6 | 1,922.3 | 1,827.9 | 1,738.1 | 1,652.8 | 1,571.6 |
| Revenue Growth, % | 0 | 27.35 | 4.36 | -36.45 | -14.91 | -4.91 | -4.91 | -4.91 | -4.91 | -4.91 |
| EBITDA | -972.2 | 107.0 | 78.7 | -277.7 | 31.1 | -152.3 | -144.9 | -137.7 | -131.0 | -124.5 |
| EBITDA, % | -34.56 | 2.99 | 2.1 | -11.69 | 1.54 | -7.92 | -7.92 | -7.92 | -7.92 | -7.92 |
| Depreciation | 82.9 | 54.7 | 47.0 | 38.9 | 11.6 | 30.5 | 29.0 | 27.6 | 26.3 | 25.0 |
| Depreciation, % | 2.95 | 1.53 | 1.26 | 1.64 | 0.57447 | 1.59 | 1.59 | 1.59 | 1.59 | 1.59 |
| EBIT | -1,055.1 | 52.4 | 31.6 | -316.7 | 19.5 | -182.9 | -173.9 | -165.4 | -157.2 | -149.5 |
| EBIT, % | -37.51 | 1.46 | 0.84649 | -13.33 | 0.96221 | -9.51 | -9.51 | -9.51 | -9.51 | -9.51 |
| Total Cash | 549.3 | 690.3 | 556.9 | 664.4 | 483.2 | 405.8 | 385.9 | 366.9 | 348.9 | 331.8 |
| Total Cash, percent | .0 | .0 | .0 | .0 | .0 | .0 | .0 | .0 | .0 | .0 |
| Account Receivables | 947.5 | 1,215.1 | 1,392.0 | 903.8 | 916.2 | 723.5 | 688.0 | 654.2 | 622.1 | 591.5 |
| Account Receivables, % | 33.68 | 33.92 | 37.23 | 38.04 | 45.32 | 37.64 | 37.64 | 37.64 | 37.64 | 37.64 |
| Inventories | 431.0 | 535.1 | 417.9 | 471.9 | 297.0 | 292.1 | 277.8 | 264.1 | 251.2 | 238.8 |
| Inventories, % | 15.32 | 14.94 | 11.18 | 19.86 | 14.69 | 15.2 | 15.2 | 15.2 | 15.2 | 15.2 |
| Accounts Payable | 765.0 | 1,030.6 | 954.1 | 878.4 | 612.0 | 571.8 | 543.7 | 517.0 | 491.6 | 467.5 |
| Accounts Payable, % | 27.19 | 28.77 | 25.52 | 36.97 | 30.27 | 29.75 | 29.75 | 29.75 | 29.75 | 29.75 |
| Capital Expenditure | -11.9 | -28.1 | -1.1 | -2.8 | -1.7 | -5.5 | -5.3 | -5.0 | -4.8 | -4.5 |
| Capital Expenditure, % | -0.42282 | -0.78323 | -0.03061048 | -0.11615 | -0.08566894 | -0.2877 | -0.2877 | -0.2877 | -0.2877 | -0.2877 |
| Tax Rate, % | 3.44 | 3.44 | 3.44 | 3.44 | 3.44 | 3.44 | 3.44 | 3.44 | 3.44 | 3.44 |
| EBITAT | -1,071.5 | 58.2 | 24.5 | -341.0 | 18.8 | -173.4 | -164.9 | -156.8 | -149.1 | -141.8 |
| Depreciation | ||||||||||
| Changes in Account Receivables | ||||||||||
| Changes in Inventories | ||||||||||
| Changes in Accounts Payable | ||||||||||
| Capital Expenditure | ||||||||||
| UFCF | -1,614.0 | -21.3 | -65.8 | 53.6 | -75.1 | 8.8 | -119.3 | -113.5 | -107.9 | -102.6 |
| WACC, % | 4.55 | 4.55 | 4.5 | 4.55 | 4.54 | 4.54 | 4.54 | 4.54 | 4.54 | 4.54 |
| PV UFCF | ||||||||||
| SUM PV UFCF | -372.6 | |||||||||
| Long Term Growth Rate, % | 3.50 | |||||||||
| Free cash flow (T + 1) | -106 | |||||||||
| Terminal Value | -10,238 | |||||||||
| Present Terminal Value | -8,201 | |||||||||
| Enterprise Value | -8,574 | |||||||||
| Net Debt | -254 | |||||||||
| Equity Value | -8,320 | |||||||||
| Diluted Shares Outstanding, MM | 661 | |||||||||
| Equity Value Per Share | -12.58 |
Benefits You Will Receive
- Adjustable Forecast Variables: Modify key assumptions (growth %, margins, WACC) effortlessly to explore various scenarios.
- Relevant Financial Data: Ronglian Group Ltd.’s (002642SZ) financials are pre-loaded to facilitate your analysis.
- Automated DCF Calculations: This template computes Net Present Value (NPV) and intrinsic value automatically.
- Professional and Customizable: A refined Excel model tailored to meet your valuation requirements.
- Designed for Analysts and Investors: Perfect for evaluating projections, confirming strategies, and optimizing your time.
Key Features
- Customizable Forecast Inputs: Adjust essential metrics such as revenue growth, EBITDA %, and capital investments.
- Instant DCF Valuation: Quickly computes intrinsic value, NPV, and additional financial metrics.
- High-Precision Accuracy: Leverages Ronglian Group Ltd.’s (002642SZ) actual financial data for credible valuation results.
- Effortless Scenario Analysis: Easily evaluate various assumptions and analyze different outcomes.
- Efficiency-Boosting Tool: Streamlines the valuation process, removing the need to construct intricate models from the ground up.
How It Works
- Step 1: Download the ready-to-use Excel template featuring Ronglian Group Ltd.’s data.
- Step 2: Review the pre-populated sheets to familiarize yourself with the key performance indicators.
- Step 3: Modify forecasts and assumptions in the editable yellow cells (WACC, growth, margins).
- Step 4: Instantly observe the updated results, including Ronglian Group Ltd.’s intrinsic value.
- Step 5: Use the outputs to make educated investment choices or create detailed reports.
Why Opt for Ronglian Group Ltd. (002642SZ) Calculator?
- All-in-One Solution: Integrates DCF, WACC, and key financial ratio analyses seamlessly.
- Adjustable Inputs: Modify the highlighted cells to explore different financial scenarios.
- In-Depth Analysis: Automatically computes Ronglian Group Ltd.’s intrinsic value and Net Present Value.
- Preloaded Information: Access to historical and projected data for precise calculations.
- High-Quality Standards: Perfect for financial analysts, investors, and business advisors.
Who Can Benefit from This Product?
- Investors: Evaluate Ronglian Group Ltd.'s (002642SZ) valuation prior to making investment decisions.
- CFOs and Financial Analysts: Optimize valuation workflows and assess financial projections.
- Startup Founders: Discover how prominent firms like Ronglian Group Ltd. (002642SZ) are appraised in the market.
- Consultants: Create comprehensive valuation reports for your clients.
- Students and Educators: Utilize real market data to learn and instruct on valuation methodologies.
Contents of the Template
- Operating and Balance Sheet Data: Pre-filled historical data and forecasts for Ronglian Group Ltd. (002642SZ), including revenue, EBITDA, EBIT, and capital expenditures.
- WACC Calculation: A dedicated sheet for calculating the Weighted Average Cost of Capital (WACC), covering elements such as Beta, risk-free rate, and share price.
- DCF Valuation (Unlevered and Levered): Customizable Discounted Cash Flow models that display intrinsic value along with detailed calculations.
- Financial Statements: Pre-loaded financial statements (annual and quarterly) to aid in comprehensive analysis.
- Key Ratios: A collection of profitability, leverage, and efficiency ratios specific to Ronglian Group Ltd. (002642SZ).
- Dashboard and Charts: A visual overview of valuation outputs and assumptions for straightforward analysis of results.
Disclaimer
All information, articles, and product details provided on this website are for general informational and educational purposes only. We do not claim any ownership over, nor do we intend to infringe upon, any trademarks, copyrights, logos, brand names, or other intellectual property mentioned or depicted on this site. Such intellectual property remains the property of its respective owners, and any references here are made solely for identification or informational purposes, without implying any affiliation, endorsement, or partnership.
We make no representations or warranties, express or implied, regarding the accuracy, completeness, or suitability of any content or products presented. Nothing on this website should be construed as legal, tax, investment, financial, medical, or other professional advice. In addition, no part of this site—including articles or product references—constitutes a solicitation, recommendation, endorsement, advertisement, or offer to buy or sell any securities, franchises, or other financial instruments, particularly in jurisdictions where such activity would be unlawful.
All content is of a general nature and may not address the specific circumstances of any individual or entity. It is not a substitute for professional advice or services. Any actions you take based on the information provided here are strictly at your own risk. You accept full responsibility for any decisions or outcomes arising from your use of this website and agree to release us from any liability in connection with your use of, or reliance upon, the content or products found herein.