
|
شركة Valiant Co.، Ltd (002643.SZ) تقييم DCF |
Fully Editable: Tailor To Your Needs In Excel Or Sheets
Professional Design: Trusted, Industry-Standard Templates
Investor-Approved Valuation Models
MAC/PC Compatible, Fully Unlocked
No Expertise Is Needed; Easy To Follow
Valiant Co.,Ltd (002643.SZ) Bundle
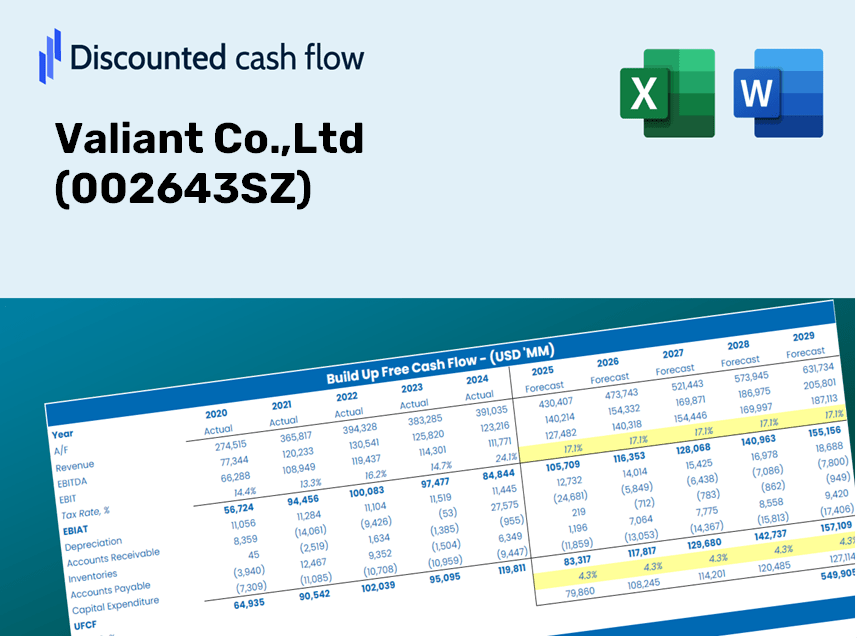
Designed for accuracy, our (002643SZ) DCF Calculator empowers you to evaluate Valiant Co., Ltd's valuation using real-world financial data, offering complete flexibility to modify all key parameters for improved projections.
Discounted Cash Flow (DCF) - (USD MM)
| Year | AY1 2020 |
AY2 2021 |
AY3 2022 |
AY4 2023 |
AY5 2024 |
FY1 2025 |
FY2 2026 |
FY3 2027 |
FY4 2028 |
FY5 2029 |
|---|---|---|---|---|---|---|---|---|---|---|
| Revenue | 2,918.1 | 4,358.5 | 5,080.5 | 4,305.3 | 3,693.3 | 4,029.8 | 4,397.1 | 4,797.8 | 5,235.0 | 5,712.0 |
| Revenue Growth, % | 0 | 49.36 | 16.56 | -15.26 | -14.22 | 9.11 | 9.11 | 9.11 | 9.11 | 9.11 |
| EBITDA | 677.5 | 1,054.1 | 1,261.3 | 1,321.3 | 822.6 | 1,009.0 | 1,101.0 | 1,201.3 | 1,310.8 | 1,430.2 |
| EBITDA, % | 23.22 | 24.18 | 24.83 | 30.69 | 22.27 | 25.04 | 25.04 | 25.04 | 25.04 | 25.04 |
| Depreciation | 18.0 | 293.1 | 397.4 | 434.4 | 426.8 | 296.7 | 323.7 | 353.2 | 385.4 | 420.5 |
| Depreciation, % | 0.61529 | 6.73 | 7.82 | 10.09 | 11.56 | 7.36 | 7.36 | 7.36 | 7.36 | 7.36 |
| EBIT | 659.5 | 761.0 | 863.9 | 886.9 | 395.8 | 712.3 | 777.2 | 848.1 | 925.4 | 1,009.7 |
| EBIT, % | 22.6 | 17.46 | 17 | 20.6 | 10.72 | 17.68 | 17.68 | 17.68 | 17.68 | 17.68 |
| Total Cash | 1,047.8 | 1,353.6 | 1,187.0 | 1,254.6 | 1,235.4 | 1,232.5 | 1,344.8 | 1,467.3 | 1,601.0 | 1,746.9 |
| Total Cash, percent | .0 | .0 | .0 | .0 | .0 | .0 | .0 | .0 | .0 | .0 |
| Account Receivables | 565.2 | 475.2 | 463.8 | 705.3 | 616.8 | 584.2 | 637.4 | 695.5 | 758.9 | 828.0 |
| Account Receivables, % | 19.37 | 10.9 | 9.13 | 16.38 | 16.7 | 14.5 | 14.5 | 14.5 | 14.5 | 14.5 |
| Inventories | 1,192.8 | 1,505.3 | 1,967.5 | 1,957.3 | 1,795.9 | 1,678.2 | 1,831.2 | 1,998.0 | 2,180.1 | 2,378.8 |
| Inventories, % | 40.88 | 34.54 | 38.73 | 45.46 | 48.63 | 41.65 | 41.65 | 41.65 | 41.65 | 41.65 |
| Accounts Payable | 383.5 | 669.8 | 937.1 | 595.3 | 476.7 | 593.9 | 648.0 | 707.1 | 771.5 | 841.8 |
| Accounts Payable, % | 13.14 | 15.37 | 18.45 | 13.83 | 12.91 | 14.74 | 14.74 | 14.74 | 14.74 | 14.74 |
| Capital Expenditure | -659.1 | -731.5 | -1,295.0 | -1,395.6 | -1,108.4 | -1,025.9 | -1,119.4 | -1,221.4 | -1,332.7 | -1,454.1 |
| Capital Expenditure, % | -22.59 | -16.78 | -25.49 | -32.41 | -30.01 | -25.46 | -25.46 | -25.46 | -25.46 | -25.46 |
| Tax Rate, % | 40.73 | 40.73 | 40.73 | 40.73 | 40.73 | 40.73 | 40.73 | 40.73 | 40.73 | 40.73 |
| EBITAT | 528.0 | 621.6 | 655.5 | 711.5 | 234.6 | 537.3 | 586.2 | 639.6 | 697.9 | 761.5 |
| Depreciation | ||||||||||
| Changes in Account Receivables | ||||||||||
| Changes in Inventories | ||||||||||
| Changes in Accounts Payable | ||||||||||
| Capital Expenditure | ||||||||||
| UFCF | -1,487.6 | 247.0 | -425.6 | -822.8 | -315.8 | 75.6 | -361.5 | -394.5 | -430.4 | -469.6 |
| WACC, % | 7.46 | 7.47 | 7.45 | 7.46 | 7.37 | 7.44 | 7.44 | 7.44 | 7.44 | 7.44 |
| PV UFCF | ||||||||||
| SUM PV UFCF | -1,211.8 | |||||||||
| Long Term Growth Rate, % | 3.00 | |||||||||
| Free cash flow (T + 1) | -484 | |||||||||
| Terminal Value | -10,886 | |||||||||
| Present Terminal Value | -7,603 | |||||||||
| Enterprise Value | -8,815 | |||||||||
| Net Debt | 611 | |||||||||
| Equity Value | -9,426 | |||||||||
| Diluted Shares Outstanding, MM | 947 | |||||||||
| Equity Value Per Share | -9.95 |
What You Will Receive
- Authentic Valiant Co. Financials: Provides both historical and projected data for precise valuation.
- Customizable Parameters: Adjust WACC, tax rates, revenue growth, and capital expenditures as needed.
- Automated Calculations: Intrinsic value and NPV are computed automatically.
- Scenario Analysis: Explore various scenarios to assess the future performance of Valiant Co. (002643SZ).
- User-Friendly Interface: Designed for professionals, yet easy to navigate for newcomers.
Highlighted Features
- Authentic Financial Data: Gain access to precise, pre-loaded historical figures and anticipated projections for Valiant Co., Ltd (002643SZ).
- Adjustable Forecast Parameters: Modify the yellow-highlighted cells to tailor metrics such as WACC, growth rates, and profit margins.
- Real-time Calculations: Enjoy automatic adjustments for DCF, Net Present Value (NPV), and cash flow assessments.
- Interactive Dashboard: Utilize clear charts and overviews to effectively visualize your valuation analysis.
- Designed for All Skill Levels: A user-friendly layout crafted for investors, CFOs, and consultants alike.
How It Functions
- Download the Template: Gain immediate access to the Excel-based Valiant Co.,Ltd DCF Calculator.
- Enter Your Assumptions: Modify the cells highlighted in yellow for growth rates, WACC, margins, and additional inputs.
- Instant Calculations: The model automatically recalculates Valiant Co.,Ltd's intrinsic value.
- Test Different Scenarios: Simulate various assumptions to assess potential changes in valuation.
- Analyze and Make Decisions: Leverage the results to inform your investment strategies or financial assessments.
Why Opt for This Calculator?
- User-Friendly Interface: Perfectly crafted for both novices and seasoned users.
- Adjustable Parameters: Effortlessly customize inputs to suit your analytical needs.
- Real-Time Feedback: Monitor live updates to Valiant Co.,Ltd’s valuation as you change inputs.
- Pre-Configured: Comes complete with Valiant Co.,Ltd’s actual financial data for swift assessments.
- Relied Upon by Experts: Favored by investors and analysts for informed decision-making.
Who Can Benefit from Valiant Co., Ltd (002643SZ)?
- Investors: Make informed investment choices with our advanced valuation tool.
- Financial Analysts: Streamline your workflow with a ready-to-customize DCF model.
- Consultants: Effortlessly modify the template for client briefs or presentations.
- Finance Enthusiasts: Enhance your grasp of valuation methods through practical, real-life examples.
- Educators and Students: Leverage this resource as a hands-on tool for finance education.
What the Template Includes
- Preloaded Valiant Co., Ltd Data: Historical and projected financial metrics, such as revenue, EBIT, and capital expenditures.
- DCF and WACC Models: Professional-grade spreadsheets designed for calculating intrinsic value and Weighted Average Cost of Capital.
- Editable Inputs: Cells highlighted in yellow for customizing revenue growth rates, tax rates, and discount rates.
- Financial Statements: Detailed annual and quarterly financial reports for in-depth analysis.
- Key Ratios: Metrics for profitability, leverage, and efficiency to assess company performance.
- Dashboard and Charts: Graphical representations of valuation results and underlying assumptions.
Disclaimer
All information, articles, and product details provided on this website are for general informational and educational purposes only. We do not claim any ownership over, nor do we intend to infringe upon, any trademarks, copyrights, logos, brand names, or other intellectual property mentioned or depicted on this site. Such intellectual property remains the property of its respective owners, and any references here are made solely for identification or informational purposes, without implying any affiliation, endorsement, or partnership.
We make no representations or warranties, express or implied, regarding the accuracy, completeness, or suitability of any content or products presented. Nothing on this website should be construed as legal, tax, investment, financial, medical, or other professional advice. In addition, no part of this site—including articles or product references—constitutes a solicitation, recommendation, endorsement, advertisement, or offer to buy or sell any securities, franchises, or other financial instruments, particularly in jurisdictions where such activity would be unlawful.
All content is of a general nature and may not address the specific circumstances of any individual or entity. It is not a substitute for professional advice or services. Any actions you take based on the information provided here are strictly at your own risk. You accept full responsibility for any decisions or outcomes arising from your use of this website and agree to release us from any liability in connection with your use of, or reliance upon, the content or products found herein.