
|
شركة Haisco Pharmaceutical Group Co.، Ltd. (002653.SZ) تقييم DCF |
Fully Editable: Tailor To Your Needs In Excel Or Sheets
Professional Design: Trusted, Industry-Standard Templates
Investor-Approved Valuation Models
MAC/PC Compatible, Fully Unlocked
No Expertise Is Needed; Easy To Follow
Haisco Pharmaceutical Group Co., Ltd. (002653.SZ) Bundle
Evaluate the financial outlook of Haisco Pharmaceutical Group Co., Ltd. like an expert! This (002653SZ) DCF Calculator provides pre-filled financial data along with the freedom to modify revenue growth, WACC, margins, and other essential assumptions to align with your projections.
Discounted Cash Flow (DCF) - (USD MM)
| Year | AY1 2020 |
AY2 2021 |
AY3 2022 |
AY4 2023 |
AY5 2024 |
FY1 2025 |
FY2 2026 |
FY3 2027 |
FY4 2028 |
FY5 2029 |
|---|---|---|---|---|---|---|---|---|---|---|
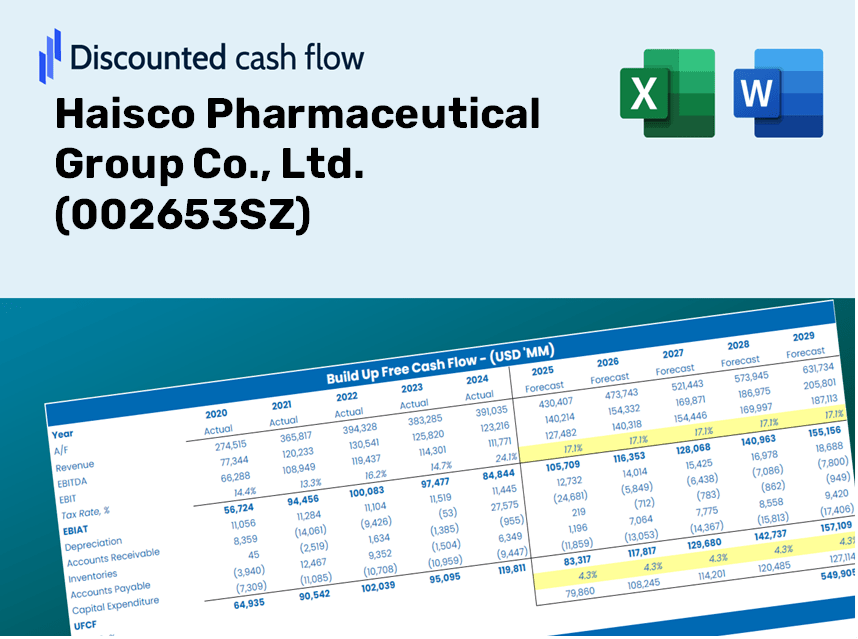
| Revenue | 3,329.6 | 2,773.3 | 3,015.3 | 3,355.1 | 3,721.3 | 3,853.5 | 3,990.3 | 4,132.0 | 4,278.7 | 4,430.7 |
| Revenue Growth, % | 0 | -16.71 | 8.73 | 11.27 | 10.92 | 3.55 | 3.55 | 3.55 | 3.55 | 3.55 |
| EBITDA | 332.9 | 183.9 | 317.3 | 544.3 | 498.4 | 437.5 | 453.1 | 469.1 | 485.8 | 503.0 |
| EBITDA, % | 10 | 6.63 | 10.52 | 16.22 | 13.39 | 11.35 | 11.35 | 11.35 | 11.35 | 11.35 |
| Depreciation | 104.6 | 146.3 | 175.8 | 212.7 | 236.3 | 207.6 | 215.0 | 222.6 | 230.5 | 238.7 |
| Depreciation, % | 3.14 | 5.28 | 5.83 | 6.34 | 6.35 | 5.39 | 5.39 | 5.39 | 5.39 | 5.39 |
| EBIT | 228.3 | 37.6 | 141.6 | 331.6 | 262.0 | 229.9 | 238.1 | 246.5 | 255.3 | 264.4 |
| EBIT, % | 6.86 | 1.36 | 4.69 | 9.88 | 7.04 | 5.97 | 5.97 | 5.97 | 5.97 | 5.97 |
| Total Cash | 824.3 | 575.1 | 775.4 | 1,328.8 | 1,206.2 | 1,103.8 | 1,143.0 | 1,183.6 | 1,225.7 | 1,269.2 |
| Total Cash, percent | .0 | .0 | .0 | .0 | .0 | .0 | .0 | .0 | .0 | .0 |
| Account Receivables | 599.9 | 665.3 | 803.8 | 883.9 | 1,117.0 | 963.5 | 997.8 | 1,033.2 | 1,069.9 | 1,107.9 |
| Account Receivables, % | 18.02 | 23.99 | 26.66 | 26.35 | 30.02 | 25 | 25 | 25 | 25 | 25 |
| Inventories | 223.9 | 259.9 | 346.0 | 281.3 | 271.6 | 333.4 | 345.2 | 357.5 | 370.2 | 383.3 |
| Inventories, % | 6.72 | 9.37 | 11.47 | 8.38 | 7.3 | 8.65 | 8.65 | 8.65 | 8.65 | 8.65 |
| Accounts Payable | 420.0 | 301.4 | 242.4 | 209.0 | 195.9 | 331.5 | 343.3 | 355.5 | 368.1 | 381.2 |
| Accounts Payable, % | 12.61 | 10.87 | 8.04 | 6.23 | 5.26 | 8.6 | 8.6 | 8.6 | 8.6 | 8.6 |
| Capital Expenditure | -601.7 | -702.9 | -700.2 | -391.0 | -440.7 | -694.7 | -719.3 | -744.9 | -771.3 | -798.7 |
| Capital Expenditure, % | -18.07 | -25.35 | -23.22 | -11.65 | -11.84 | -18.03 | -18.03 | -18.03 | -18.03 | -18.03 |
| Tax Rate, % | 14.58 | 14.58 | 14.58 | 14.58 | 14.58 | 14.58 | 14.58 | 14.58 | 14.58 | 14.58 |
| EBITAT | 210.8 | 25.4 | 107.0 | 323.5 | 223.8 | 192.4 | 199.3 | 206.3 | 213.7 | 221.2 |
| Depreciation | ||||||||||
| Changes in Account Receivables | ||||||||||
| Changes in Inventories | ||||||||||
| Changes in Accounts Payable | ||||||||||
| Capital Expenditure | ||||||||||
| UFCF | -690.1 | -751.2 | -700.9 | 96.3 | -217.0 | -67.4 | -339.4 | -351.4 | -363.9 | -376.9 |
| WACC, % | 4.51 | 4.49 | 4.5 | 4.51 | 4.51 | 4.5 | 4.5 | 4.5 | 4.5 | 4.5 |
| PV UFCF | ||||||||||
| SUM PV UFCF | -1,290.6 | |||||||||
| Long Term Growth Rate, % | 4.00 | |||||||||
| Free cash flow (T + 1) | -392 | |||||||||
| Terminal Value | -77,745 | |||||||||
| Present Terminal Value | -62,374 | |||||||||
| Enterprise Value | -63,665 | |||||||||
| Net Debt | 116 | |||||||||
| Equity Value | -63,781 | |||||||||
| Diluted Shares Outstanding, MM | 1,120 | |||||||||
| Equity Value Per Share | -56.95 |
Benefits You Will Receive
- Customizable Excel Template: An adaptable Excel-based DCF Calculator featuring pre-filled financial data for Haisco Pharmaceutical Group Co., Ltd. (002653SZ).
- Authentic Financial Data: Access to historical figures and projected estimates (indicated in the highlighted cells).
- Flexible Forecasting: Modify key assumptions such as revenue growth, EBITDA margins, and WACC.
- Real-Time Calculations: Instantly observe how your inputs influence the valuation of Haisco Pharmaceutical Group Co., Ltd. (002653SZ).
- Professional-Grade Tool: Designed for investors, CFOs, consultants, and financial analysts.
- Intuitive Layout: Organized for simplicity and ease of navigation, complete with step-by-step guidance.
Key Features
- Pre-Loaded Data: Haisco Pharmaceutical Group Co., Ltd.'s historical financial reports and pre-entered projections.
- Fully Customizable Inputs: Adjust parameters such as WACC, tax rates, revenue growth, and EBITDA margins.
- Instant Results: Observe the recalculation of Haisco's intrinsic value in real time.
- Clear Visual Outputs: Dashboard graphs showcase valuation outcomes and essential metrics.
- Designed for Precision: A professional resource tailored for analysts, investors, and finance professionals.
How It Functions
- Step 1: Download the Excel spreadsheet.
- Step 2: Examine the pre-filled data for Haisco Pharmaceutical Group Co., Ltd. (002653SZ) including both historical and projected figures.
- Step 3: Modify key assumptions (highlighted in yellow) in accordance with your insights.
- Step 4: Observe the automatic recalculations reflecting the intrinsic value of Haisco Pharmaceutical Group Co., Ltd. (002653SZ).
- Step 5: Utilize the results for your investment strategies or financial reporting.
Why Opt for This Financial Calculator?
- All-in-One Solution: Incorporates DCF, WACC, and crucial financial ratio analyses in a single tool.
- Tailorable Inputs: Modify the highlighted cells to explore different financial scenarios.
- In-Depth Analysis: Automatically computes the intrinsic value and Net Present Value for Haisco Pharmaceutical Group Co., Ltd. (002653SZ).
- Preloaded Information: Comes with historical and projected data for a reliable analysis foundation.
- High-Caliber Tool: Perfect for financial analysts, investors, and business consultants.
Who Should Benefit from Haisco Pharmaceutical Group's Products?
- Individual Investors: Gain insights for making informed decisions regarding investments in Haisco Pharmaceutical Group (002653SZ).
- Financial Analysts: Enhance valuation methodologies with comprehensive financial models tailored for the pharmaceutical sector.
- Consultants: Provide clients with precise and timely valuation assessments based on Haisco's performance.
- Business Owners: Learn from Haisco Pharmaceutical Group's valuation strategies to inform your own business plans.
- Finance Students: Explore valuation practices through the lens of real-world pharmaceutical data and case studies.
Contents of the Haisco Pharmaceutical Template
- Comprehensive DCF Model: An editable template featuring meticulous valuation computations.
- Real-World Data: Historical and projected financials for Haisco Pharmaceutical Group Co., Ltd. (002653SZ) preloaded for analysis.
- Customizable Parameters: Modify WACC, growth rates, and tax assumptions to explore various scenarios.
- Financial Statements: Complete annual and quarterly breakdowns for enhanced insights.
- Key Ratios: Integrated analysis focusing on profitability, efficiency, and leverage metrics.
- Dashboard with Visual Outputs: Charts and tables that present clear, actionable results.
Disclaimer
All information, articles, and product details provided on this website are for general informational and educational purposes only. We do not claim any ownership over, nor do we intend to infringe upon, any trademarks, copyrights, logos, brand names, or other intellectual property mentioned or depicted on this site. Such intellectual property remains the property of its respective owners, and any references here are made solely for identification or informational purposes, without implying any affiliation, endorsement, or partnership.
We make no representations or warranties, express or implied, regarding the accuracy, completeness, or suitability of any content or products presented. Nothing on this website should be construed as legal, tax, investment, financial, medical, or other professional advice. In addition, no part of this site—including articles or product references—constitutes a solicitation, recommendation, endorsement, advertisement, or offer to buy or sell any securities, franchises, or other financial instruments, particularly in jurisdictions where such activity would be unlawful.
All content is of a general nature and may not address the specific circumstances of any individual or entity. It is not a substitute for professional advice or services. Any actions you take based on the information provided here are strictly at your own risk. You accept full responsibility for any decisions or outcomes arising from your use of this website and agree to release us from any liability in connection with your use of, or reliance upon, the content or products found herein.