
|
شركة Western Securities Co. ، Ltd. (002673.SZ) تقييم DCF |
Fully Editable: Tailor To Your Needs In Excel Or Sheets
Professional Design: Trusted, Industry-Standard Templates
Investor-Approved Valuation Models
MAC/PC Compatible, Fully Unlocked
No Expertise Is Needed; Easy To Follow
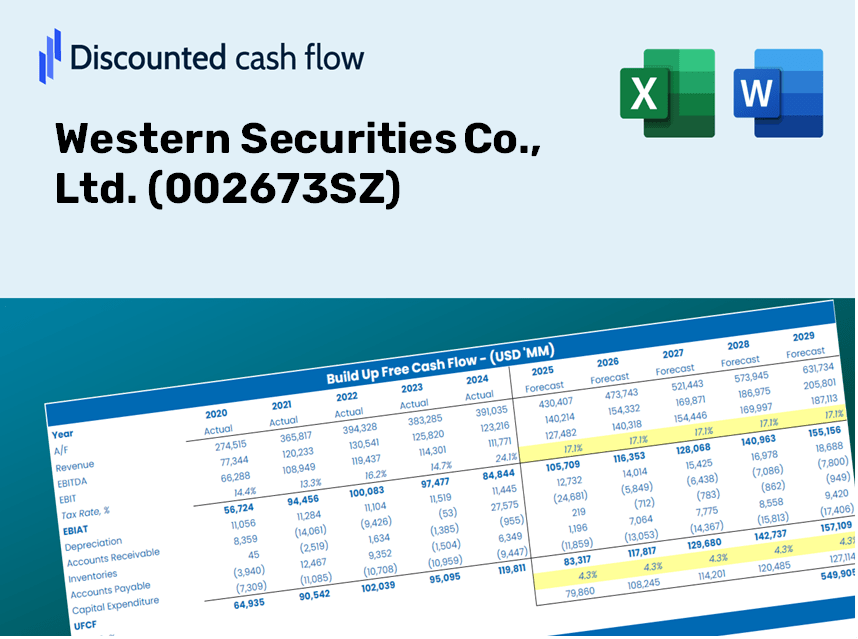
Western Securities Co., Ltd. (002673.SZ) Bundle
Designed for accuracy, our [002673SZ] DCF Calculator enables you to evaluate Western Securities Co., Ltd. valuation using real-world financial data while providing the flexibility to modify all key parameters for enhanced projections.
Discounted Cash Flow (DCF) - (USD MM)
| Year | AY1 2020 |
AY2 2021 |
AY3 2022 |
AY4 2023 |
AY5 2024 |
FY1 2025 |
FY2 2026 |
FY3 2027 |
FY4 2028 |
FY5 2029 |
|---|---|---|---|---|---|---|---|---|---|---|
| Revenue | 5,903.5 | 7,747.0 | 5,306.0 | 6,867.4 | 7,841.4 | 8,690.7 | 9,632.1 | 10,675.4 | 11,831.8 | 13,113.4 |
| Revenue Growth, % | 0 | 31.23 | -31.51 | 29.43 | 14.18 | 10.83 | 10.83 | 10.83 | 10.83 | 10.83 |
| EBITDA | 2,244.4 | 2,058.1 | 1,940.5 | -668.6 | .0 | 1,589.0 | 1,761.2 | 1,951.9 | 2,163.4 | 2,397.7 |
| EBITDA, % | 38.02 | 26.57 | 36.57 | -9.74 | 0 | 18.28 | 18.28 | 18.28 | 18.28 | 18.28 |
| Depreciation | 95.4 | 182.2 | 254.9 | 220.3 | 236.3 | 260.6 | 288.9 | 320.2 | 354.8 | 393.3 |
| Depreciation, % | 1.62 | 2.35 | 4.8 | 3.21 | 3.01 | 3 | 3 | 3 | 3 | 3 |
| EBIT | 2,149.0 | 1,875.9 | 1,685.6 | -888.9 | -236.3 | 1,328.4 | 1,472.3 | 1,631.8 | 1,808.5 | 2,004.4 |
| EBIT, % | 36.4 | 24.21 | 31.77 | -12.94 | -3.01 | 15.29 | 15.29 | 15.29 | 15.29 | 15.29 |
| Total Cash | 32,569.4 | 29,021.5 | 27,280.0 | 26,869.8 | 39,710.5 | 8,690.7 | 9,632.1 | 10,675.4 | 11,831.8 | 13,113.4 |
| Total Cash, percent | .0 | .0 | .0 | .0 | .0 | .0 | .0 | .0 | .0 | .0 |
| Account Receivables | 244.9 | 8,767.0 | 7,886.2 | 510.8 | 182.2 | 3,718.1 | 4,120.8 | 4,567.2 | 5,061.9 | 5,610.2 |
| Account Receivables, % | 4.15 | 113.17 | 148.63 | 7.44 | 2.32 | 42.78 | 42.78 | 42.78 | 42.78 | 42.78 |
| Inventories | .0 | 165.0 | 295.6 | 275.9 | .0 | 203.7 | 225.7 | 250.2 | 277.3 | 307.3 |
| Inventories, % | 0 | 2.13 | 5.57 | 4.02 | 0 | 2.34 | 2.34 | 2.34 | 2.34 | 2.34 |
| Accounts Payable | 217.3 | 277.0 | 314.3 | 547.9 | 1,188.6 | 631.2 | 699.6 | 775.4 | 859.4 | 952.5 |
| Accounts Payable, % | 3.68 | 3.58 | 5.92 | 7.98 | 15.16 | 7.26 | 7.26 | 7.26 | 7.26 | 7.26 |
| Capital Expenditure | -108.9 | -197.6 | -198.5 | -231.2 | -192.0 | -242.5 | -268.8 | -297.9 | -330.1 | -365.9 |
| Capital Expenditure, % | -1.84 | -2.55 | -3.74 | -3.37 | -2.45 | -2.79 | -2.79 | -2.79 | -2.79 | -2.79 |
| Tax Rate, % | 19.46 | 19.46 | 19.46 | 19.46 | 19.46 | 19.46 | 19.46 | 19.46 | 19.46 | 19.46 |
| EBITAT | 1,591.6 | 1,410.0 | 1,239.2 | -676.5 | -190.3 | 1,008.0 | 1,117.1 | 1,238.2 | 1,372.3 | 1,520.9 |
| Depreciation | ||||||||||
| Changes in Account Receivables | ||||||||||
| Changes in Inventories | ||||||||||
| Changes in Accounts Payable | ||||||||||
| Capital Expenditure | ||||||||||
| UFCF | 1,550.5 | -7,232.7 | 2,083.0 | 6,941.3 | 1,099.3 | -3,270.8 | 780.8 | 865.4 | 959.2 | 1,063.0 |
| WACC, % | 6.28 | 6.3 | 6.27 | 6.32 | 6.41 | 6.31 | 6.31 | 6.31 | 6.31 | 6.31 |
| PV UFCF | ||||||||||
| SUM PV UFCF | -132.0 | |||||||||
| Long Term Growth Rate, % | 2.00 | |||||||||
| Free cash flow (T + 1) | 1,084 | |||||||||
| Terminal Value | 25,139 | |||||||||
| Present Terminal Value | 18,510 | |||||||||
| Enterprise Value | 18,378 | |||||||||
| Net Debt | 9,676 | |||||||||
| Equity Value | 8,702 | |||||||||
| Diluted Shares Outstanding, MM | 4,469 | |||||||||
| Equity Value Per Share | 1.95 |
What You Will Receive
- Authentic Western Securities Data: Preloaded financial information – covering everything from revenue to EBIT – based on actual and projected metrics.
- Comprehensive Customization: Modify all essential parameters (yellow cells) such as WACC, growth percentage, and tax rates.
- Real-Time Valuation Updates: Automatic recalculations to assess the effects of adjustments on Western Securities' fair value.
- Flexible Excel Template: Designed for quick modifications, scenario analysis, and detailed forecasts.
- Efficient and Precise: Eliminate the need to build models from the ground up while ensuring accuracy and adaptability.
Key Features
- 🔍 Real-Life Western Securities Financials: Pre-filled historical and projected data for Western Securities Co., Ltd. (002673SZ).
- ✏️ Fully Customizable Inputs: Adjust all essential parameters (yellow cells) such as WACC, growth %, and tax rates.
- 📊 Professional DCF Valuation: Integrated formulas determine Western Securities' intrinsic value using the Discounted Cash Flow method.
- ⚡ Instant Results: Immediately visualize Western Securities' valuation after making adjustments.
- Scenario Analysis: Evaluate and compare outcomes for various financial assumptions side-by-side.
How It Works
- 1. Access the Template: Download and open the Excel file containing Western Securities Co., Ltd.’s preloaded data.
- 2. Adjust Inputs: Modify key parameters such as growth rates, WACC, and capital expenditures.
- 3. See Results Immediately: The DCF model automatically computes intrinsic value and NPV.
- 4. Explore Scenarios: Evaluate various forecasts to understand different valuation possibilities.
- 5. Utilize with Assurance: Present professional valuation analyses to back your strategic decisions.
Why Choose the Western Securities Co., Ltd. Calculator?
- All-in-One Solution: Features DCF, WACC, and comprehensive financial ratio analyses in one convenient tool.
- Flexible Inputs: Modify the yellow-highlighted fields to explore different financial scenarios.
- In-Depth Analysis: Automatically computes the intrinsic value and Net Present Value for Western Securities Co., Ltd. (002673SZ).
- Preloaded Information: Access historical and forecasted data for reliable initial calculations.
- Expert-Grade Tool: Perfect for financial analysts, investors, and business consultants looking to enhance their assessments.
Who Should Use This Product?
- Investors: Make informed investment decisions by accurately assessing the fair value of Western Securities Co., Ltd. (002673SZ).
- CFOs: Utilize a robust DCF model for precise financial reporting and analysis of Western Securities Co., Ltd. (002673SZ).
- Consultants: Effortlessly customize the template for client valuation reports, focusing on Western Securities Co., Ltd. (002673SZ).
- Entrepreneurs: Learn from the financial modeling practices employed by industry leaders like Western Securities Co., Ltd. (002673SZ).
- Educators: Employ this resource as a teaching aid to illustrate key valuation techniques with a focus on Western Securities Co., Ltd. (002673SZ).
What the Template Includes
- Detailed DCF Model: Fully editable template featuring in-depth valuation calculations.
- Real-World Data: Western Securities Co., Ltd.'s ([002673SZ]) historical and projected financials preloaded for your analysis.
- Customizable Assumptions: Modify WACC, growth rates, and tax parameters to test different scenarios.
- Financial Statements: Comprehensive annual and quarterly breakdowns for enhanced insights.
- Key Financial Ratios: Integrated analysis tools for evaluating profitability, efficiency, and leverage.
- Interactive Dashboard: Visual charts and tables to present clear, actionable results.
Disclaimer
All information, articles, and product details provided on this website are for general informational and educational purposes only. We do not claim any ownership over, nor do we intend to infringe upon, any trademarks, copyrights, logos, brand names, or other intellectual property mentioned or depicted on this site. Such intellectual property remains the property of its respective owners, and any references here are made solely for identification or informational purposes, without implying any affiliation, endorsement, or partnership.
We make no representations or warranties, express or implied, regarding the accuracy, completeness, or suitability of any content or products presented. Nothing on this website should be construed as legal, tax, investment, financial, medical, or other professional advice. In addition, no part of this site—including articles or product references—constitutes a solicitation, recommendation, endorsement, advertisement, or offer to buy or sell any securities, franchises, or other financial instruments, particularly in jurisdictions where such activity would be unlawful.
All content is of a general nature and may not address the specific circumstances of any individual or entity. It is not a substitute for professional advice or services. Any actions you take based on the information provided here are strictly at your own risk. You accept full responsibility for any decisions or outcomes arising from your use of this website and agree to release us from any liability in connection with your use of, or reliance upon, the content or products found herein.